Prognose der Verkehrslage in der Region Hannover
Die primäre Anforderung der Verkehrsteilnehmer im Bereich des Straßenverkehrs ist die Kenntnis der aktuellen Verkehrslage. Diese basiert in der Regel auf der wirklich benötigten Reisezeit von sehr vielen Verkehrsteilnehmern, deren Daten häufig im Kontext von Routingdiensten abgegriffen werden.
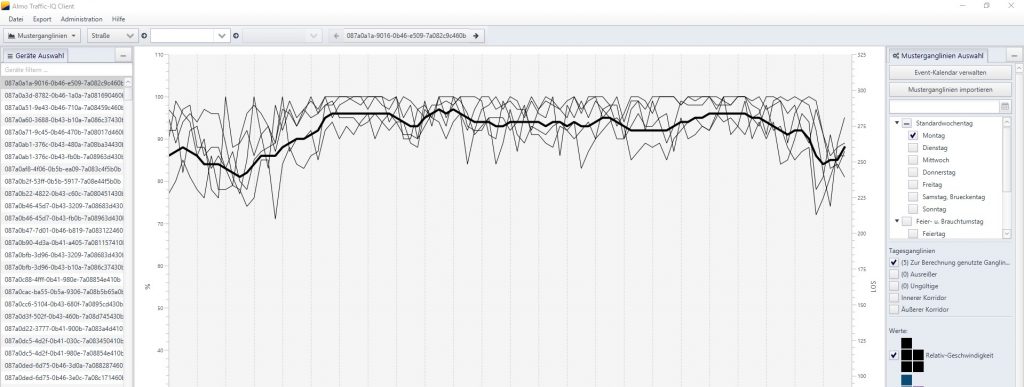
Im Rahmen von Data4UrbanMobility wurden Werkzeuge entwickelt um eine ganglineinbasierte Prognose der Verkehrslage zu ermöglichen. Die folgende Abbildung zeigt eine Oberfläche auf der typische Ganglinienverläufe und Ausreißer visualisiert werden.
![](https://data4urbanmobility.l3s.uni-hannover.de/wp-content/uploads/2019/06/ganglinien-1024x387.jpg)
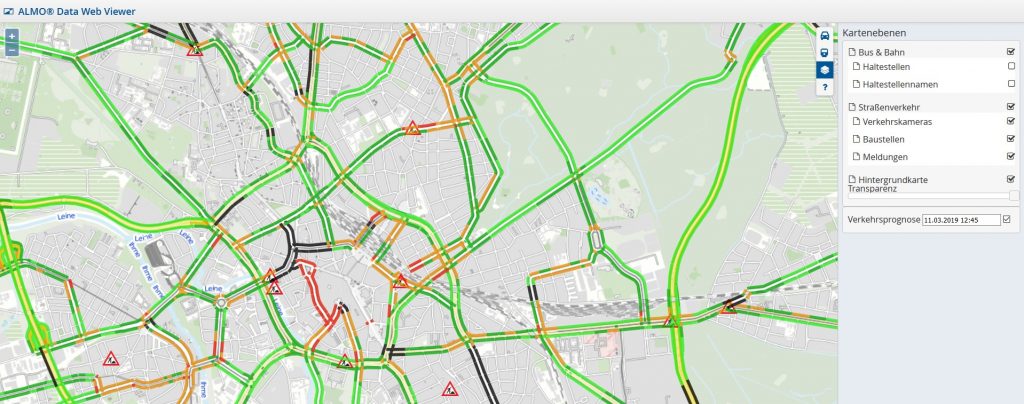
Die Prognose der Verkehrslage kann dann mittels einer Karte für den Endnutzer visualisert werden:
![](https://data4urbanmobility.l3s.uni-hannover.de/wp-content/uploads/2019/06/kartePrognose-1024x404.jpg)
Erste Version der MIC-App bereitgestellt
Eine erste Version der MIC-App (Move in the City) konnte allen Partnerinnen und Partnern des Projekts und einer geschützten Nutzer*innengruppe der Öffentlichkeit zur Verfügung gestellt werden. Die mobile App MiC ist ein Instrument zur Datenerhebung.
Dabei verknüpft MiC – eine Entwicklung des Institute for Sustainable Urbanism ISU der TU Braunschweig und Projektionisten GmbH Hannover – das wachsende Bewusstsein und die Notwendigkeit für digitale Bürger*innenrechte mit den Potentialen mittels der Auswertung großer Datenmengen neue Formen der menschzentrierten Entwicklung von Stadt und Mobilität zu ermöglichen stellt eine Möglichkeit dar, sich aktiv als Bürgerwissenschaftlerin und Bürgerwissenschaftler an der Forschung und Entwicklung der Mobilität für alle in der Stadt der Zukunft zu beteiligen.
MiC erhebt – durch die Nutzerinnen und Nutzer gesteuert – Daten zu Strecken und Art der Fortbewegung. Diese Daten werden pseudonymisiert, so dass ein Rückschluss auf die jeweilige Person nicht mehr möglich ist. Wichtig ist die Vielzahl der Nutzerinnen und Nutzer – nicht die einzelne Bewegung. Die Stadt der Zukunft zeichnet sich aus durch den barrierearmen Zugang zu Mobilität und Erreichbarkeit für alle. Der holistische Ansatz der Forscherinnen und Forscher des Institute for Sustainable Urbanism ISU (TU Braunschweig) sowie der Projektbeteiligten betrachtet Stadt dabei auf verschiedenen Maßstabsebenen und bringt intelligente Planungen – wie z.B. die 5-Minuten Stadt –, Städtebau und innovative Technologien zusammen. Für ein umfassendes Verständnis individueller Mobilität und darauf aufbauende neue Methoden und Werkzeuge für integrierte Verkehrs- und Stadtplanung werden mittels der MiC-App uns umfangreiche und detaillierte Daten darüber geliefert, wie und auf welchem Wege wir uns in der Stadt fortbewegen.
Entwicklungsstand:
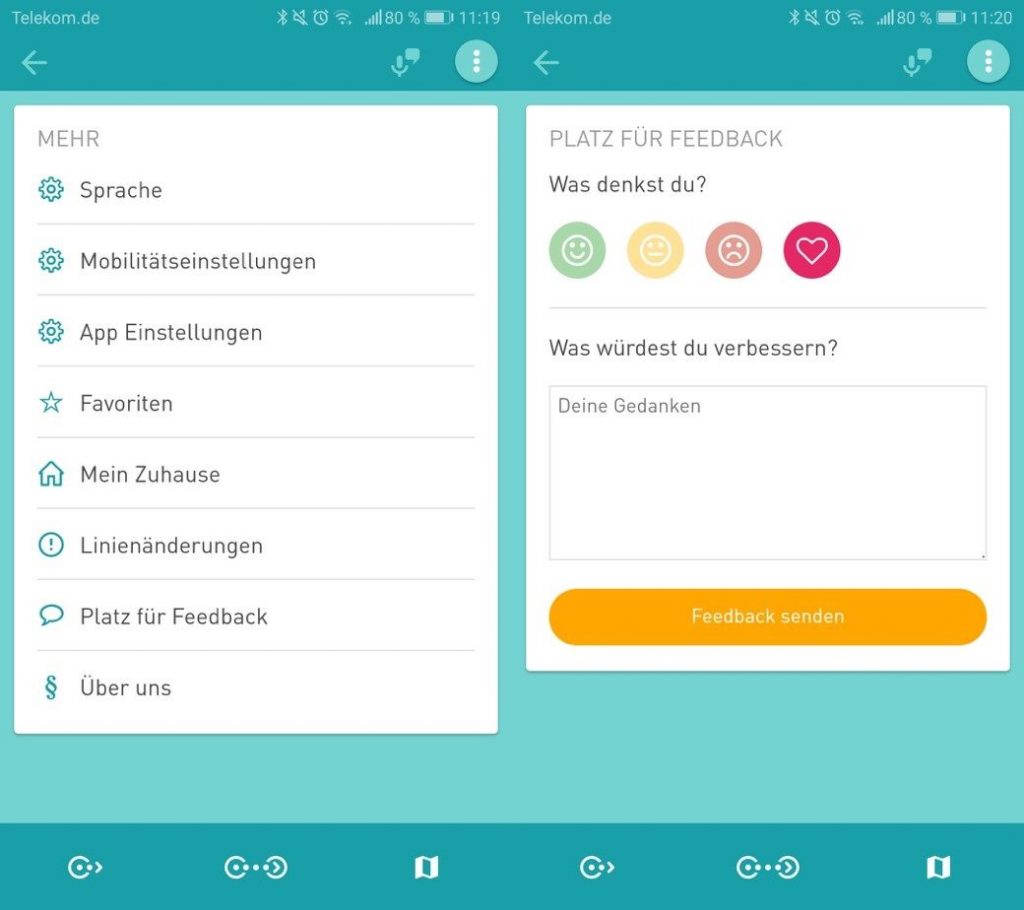
In der ersten Version ermöglicht das Stadtforschungstool MiC den Nutzer*innen durch eine einfach Handhabung das Starten und Beenden der „Tracking-Time“ (Bild 1). Wichtig ist, die Nutzer*innen entscheidet selber über den Zeitraum. Als erstes Ergebnis für die Nutzer*innen steht eine Zusammenfassung ihrer bisher aufgezeichneten Routen (Bild2). In den Einstellung (Bild 3) kann der Nutzer sich aktiv an Feedback beteiligen (Bild 4) sowie seinen Account und somit seiner zur Verfügung gestellten Daten löschen (Bild 5).
![](https://data4urbanmobility.l3s.uni-hannover.de/wp-content/uploads/2018/11/micall-1024x364.jpg)
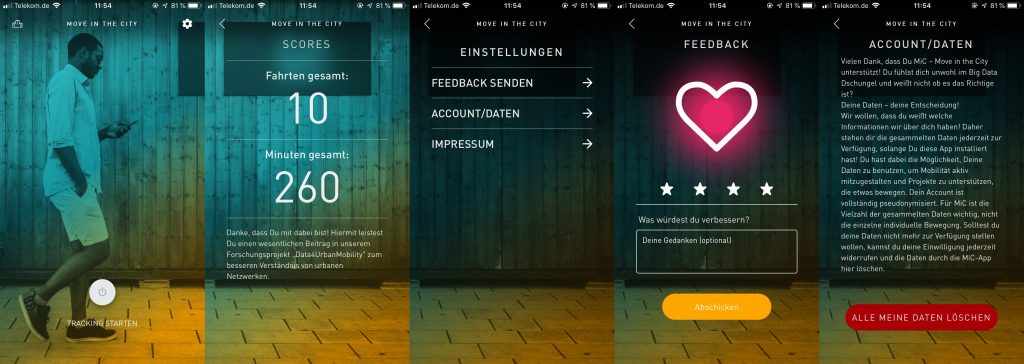
von links nach recht: Bild1-5 MIC App Interface – Attribution-NonCommercial-ShareAlike 4.0 International (CC BY-NC-SA 4.0)
Die aktuelle Weiterentwicklung sieht eine Visualisierung der Routen für den jeweiligen Nutzer vor.
Um Teil der Testgruppe zu werden ist zur Zeit noch eine Anmeldung unter: www.mic-app.org notwendig. Die Anwendung ist nicht frei im App Store / GooglePlay Store zu erhalten.
Auf der Internetseite www.mic-app.org wird zusätzlich detailliert auf häufige Fragen (FAQ) zur Anwendung sowie über Entwicklungen und Neuheiten informiert
D4UM Plattform und Dashboard V2
Die neue Version der Plattform inklusive des Dashboards gibt noch detailliertere Auskünfte über die Verkehrssituation
![](https://data4urbanmobility.l3s.uni-hannover.de/wp-content/uploads/2018/10/allEvents.png)
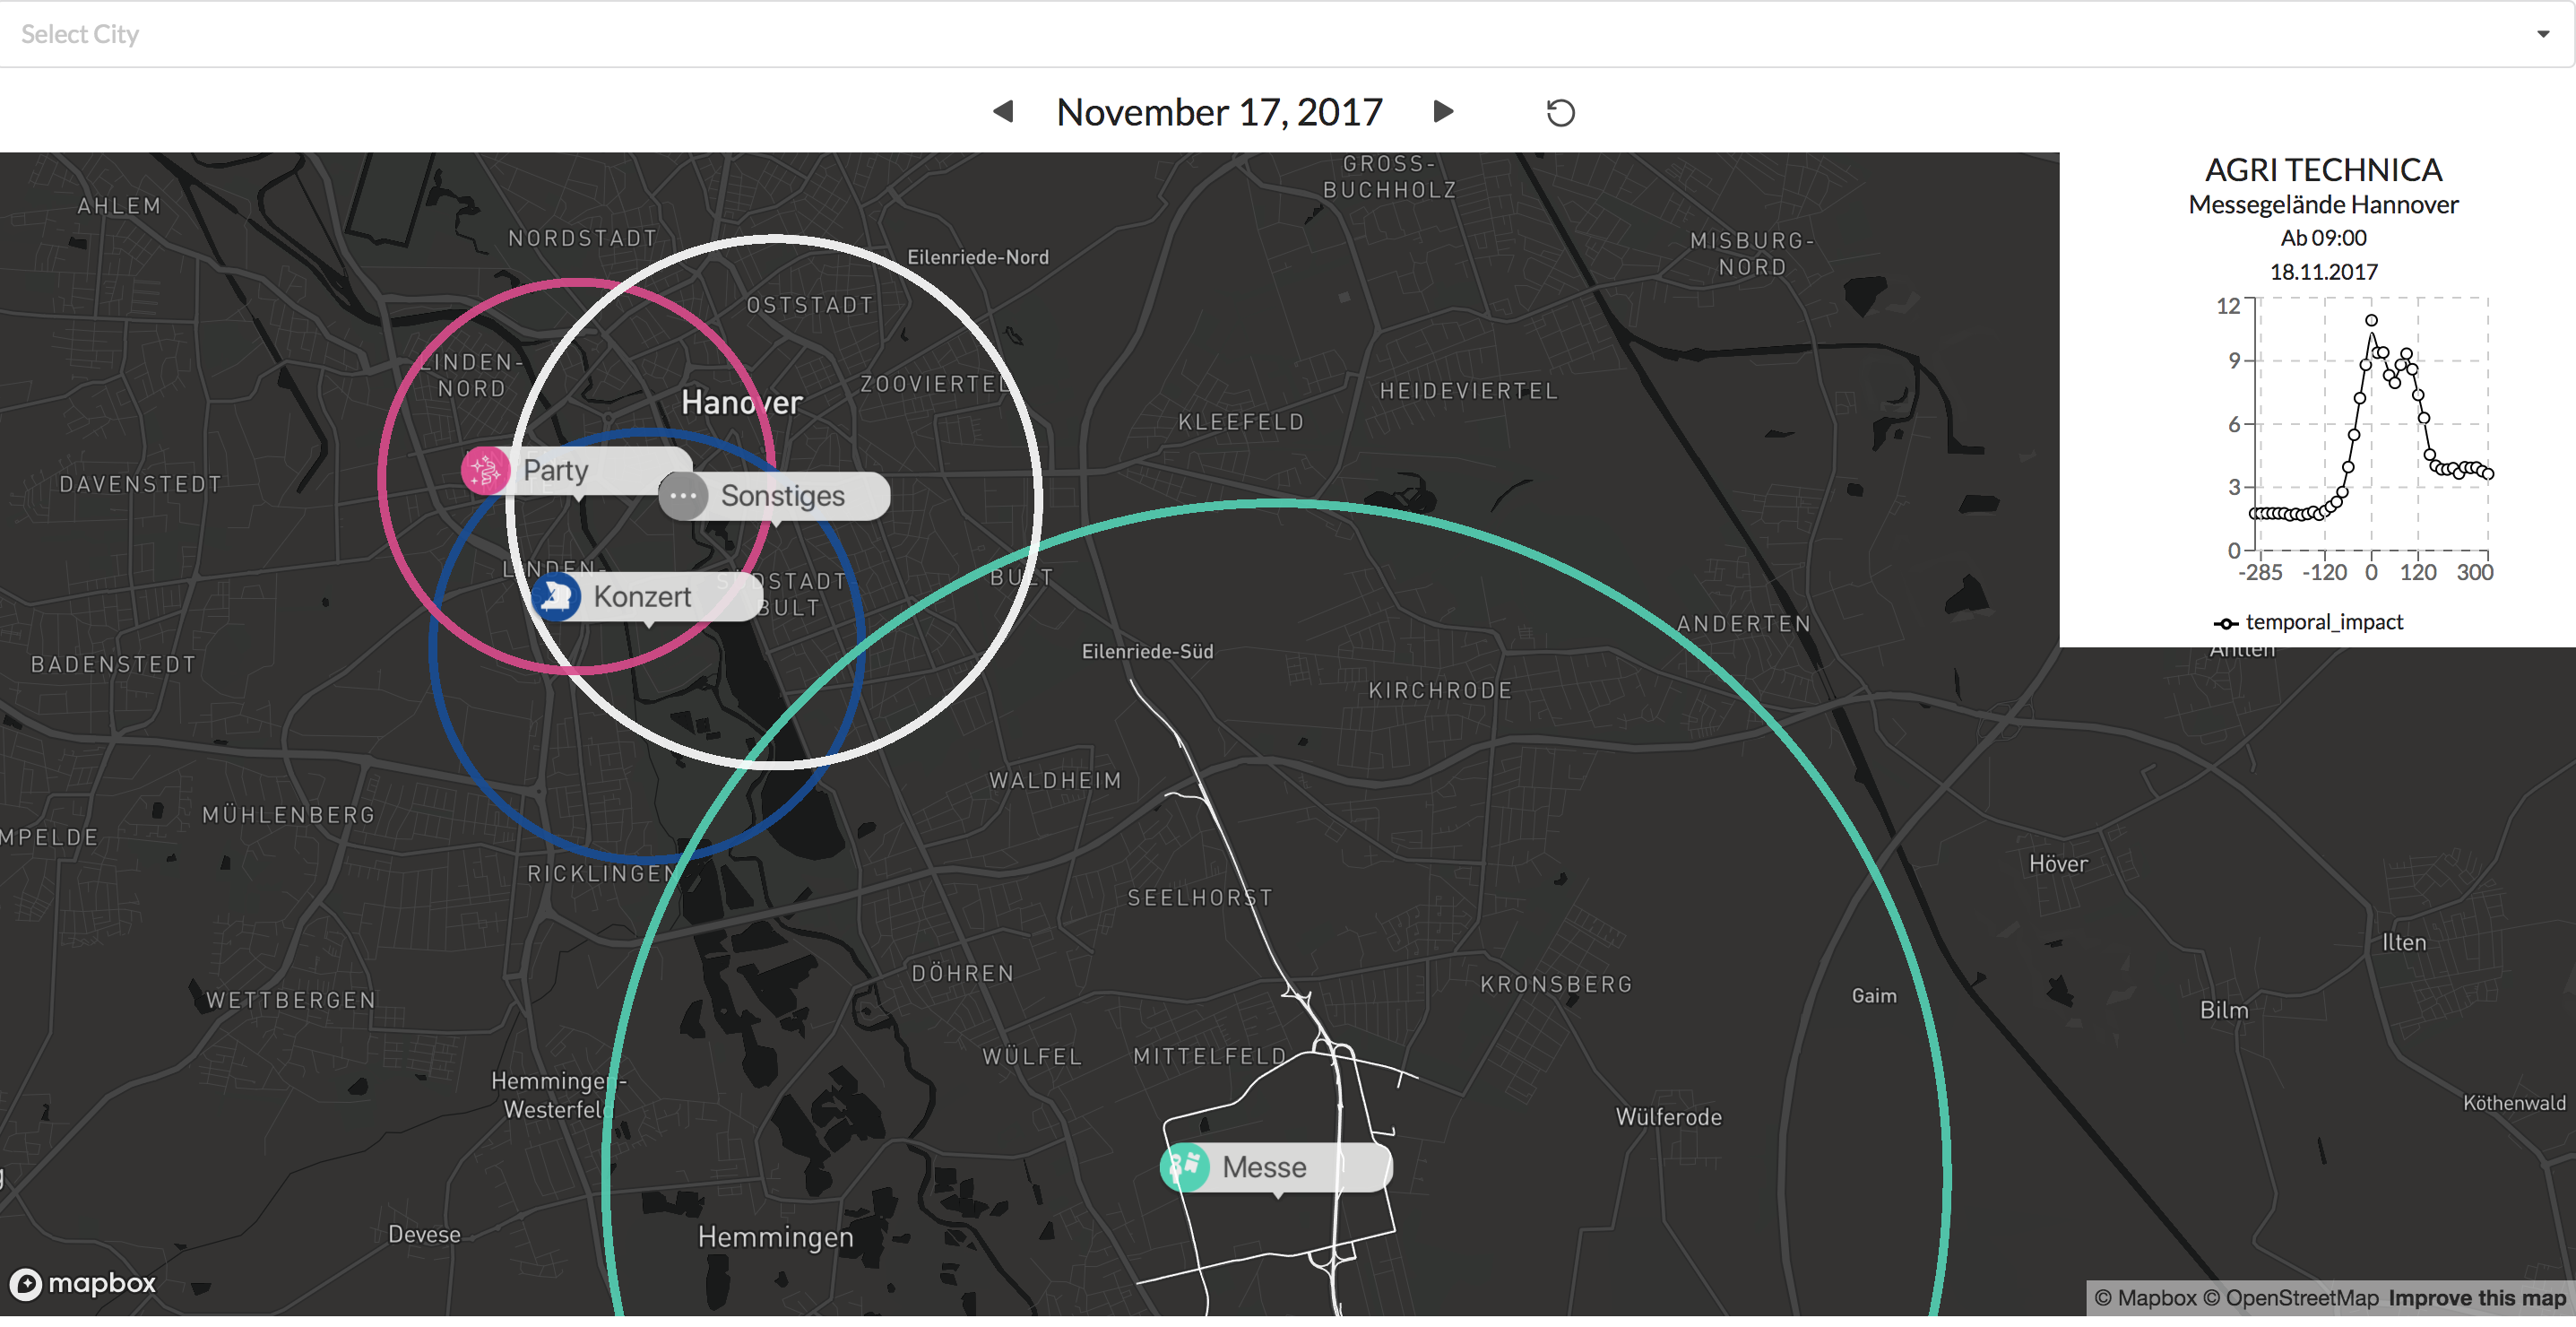
Die farblich unterschiedlichen Label lassen eine schnelle Unterscheidung zwischen den verschiedenen Event typen zu. Durch das klicken auf eines der Events wird der typically affected subgraph angezeigt für diesen Eventtyp.
![](https://data4urbanmobility.l3s.uni-hannover.de/wp-content/uploads/2018/11/concert_football-1024x502.png)
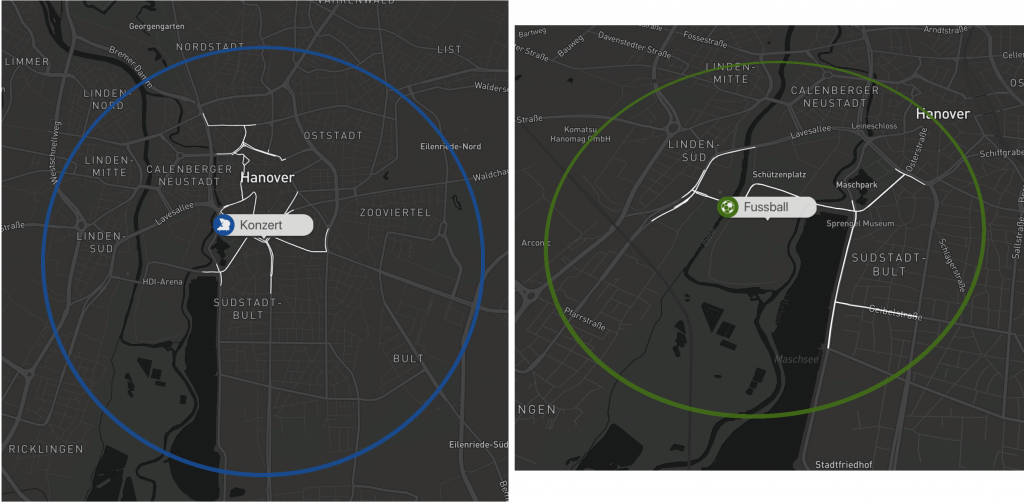
Beispiele: Visualisierungen eines Konzerts und eines Fußballspiels
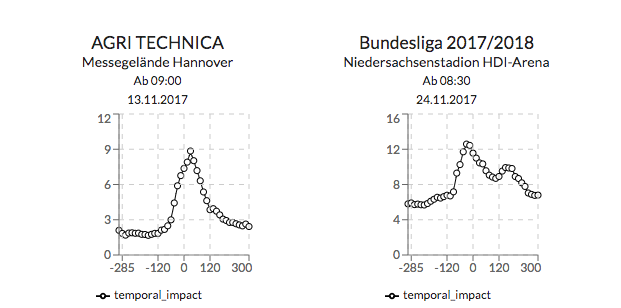
Zusätzlich gibt der Graph in der oberen rechten Ecke Auskunft über die Verkehrssituation vor und nach dem Eventstart.
![](https://data4urbanmobility.l3s.uni-hannover.de/wp-content/uploads/2018/11/graph1_2.png)
{API}
Es wurden die API Endpunkte mit zusätzlichen Information erweitert.
Diese werden mittels der als Teil der Forschung entwickelten Modellen erstellt.
Erste Version der D4UM-App bereitgestellt
Eine erste Version der D4UM-App konnte allen Partnern des Projekts zur Verfügung gestellt werden. Die App stellt eine Möglichkeit dar, sich Fahrtauskünfte mit dem öffentlichen Personennahverkehr in Niedersachsen und Bremen (Datengrundlage: EFA – elektronische Fahrplanauskunft für Niedersachsen und Bremen) ausgeben zu lassen. Im Fokus stand hierbei, dass der Nutzer schnell und einfach an die für ihn wichtigen Informationen gelangen kann, um so seine Reise möglichst simpel planen zu können.
Folgende Funktionen dienen dabei in der ersten Version der schnellen Auskunft:
Abfahrten und Verbindungen
Über die Funktion Abfahrten lassen sich Abfahrtszeiten an einer bestimmten oder an nahegelegenen Haltestellen ermitteln. Unter Verbindungen können hingegen Fahrtvorschläge von einem Startpunkt (Adresse oder Haltestelle) zu einem Zielpunkt gesucht werden. Zeiten stehen dabei auch in Echtzeit zur Verfügung, sodass auch Verspätungen direkt von dem Nutzer erkannt werden können.
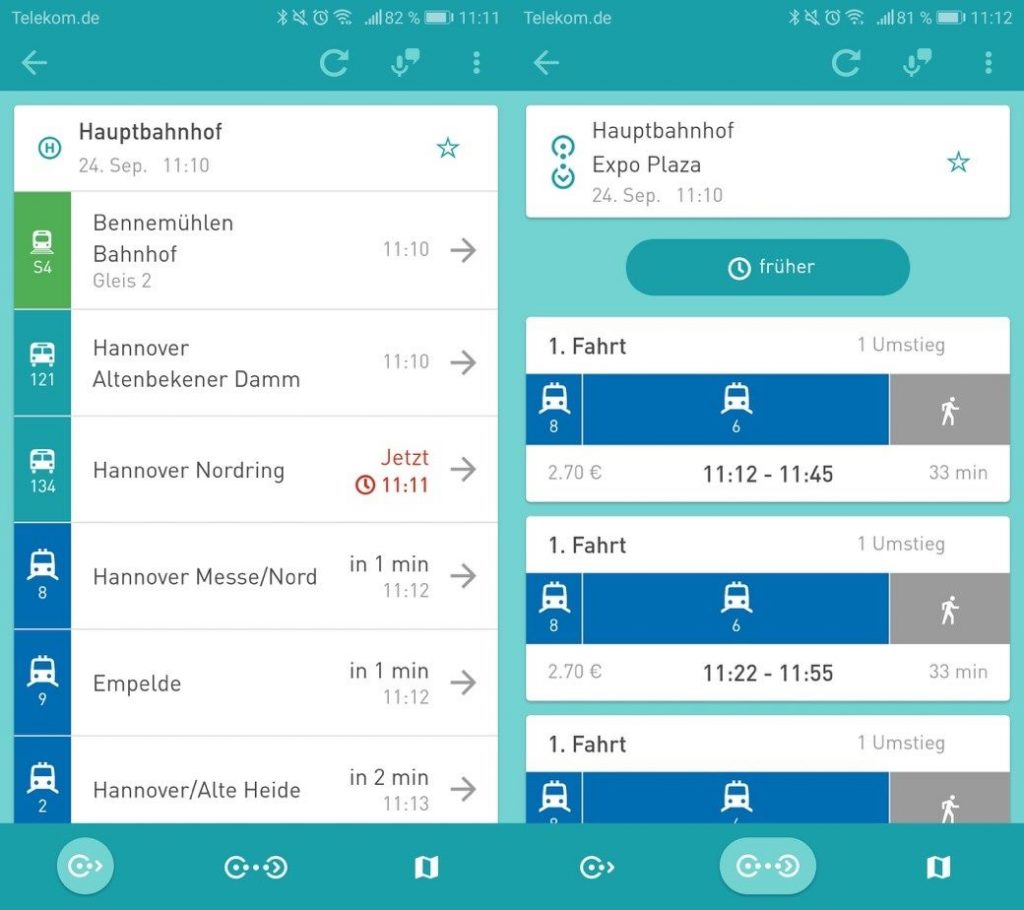
![](https://data4urbanmobility.l3s.uni-hannover.de/wp-content/uploads/2018/12/abfahrt-1024x910.jpg)
Karte
Über die Karte sind alle Haltestellen zu finden, sodass sich der Nutzer einen Überblick über die nähere Umgebung oder auch den Weg zur Haltestelle oder einem Ziel verschaffen kann.
Wird auf der Karte auf ein Haltestellensymbol oder den zugehörigen Haltestellennamen geklickt, öffnet sich der Abfahrtsmonitor zu dieser Haltestelle. Die nächsten Abfahrten können somit auch über diesen Weg aufgerufen werden.
Darüber hinaus kann sich der Nutzer auch den Verlauf seiner Fahrt anzeigen lassen.
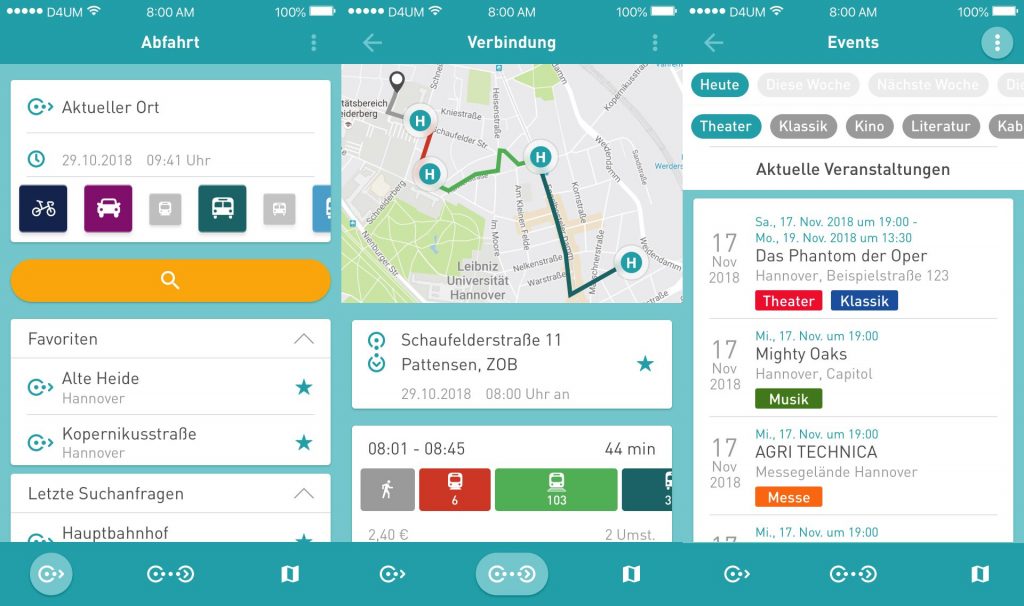
![](https://data4urbanmobility.l3s.uni-hannover.de/wp-content/uploads/2018/12/eventScreens-1024x606.jpg)
Menü/Einstellungen
Weitere Funktionen und Einstellungen finden sich ergänzend im Menü der App.
Der Nutzer bekommt hier zum einen die Möglichkeit, dass erweiterte Einstellungen zu den Suchanfragen bei Verbindungen oder Abfahrten vorgenommen werden können, und zum anderen, dass er weitere Features verwenden kann. Darunter befindet sich zum Beispiel das Feedbackformular. Hierüber kann unkompliziert Kontakt mit den Entwicklern der D4UM-App per Mail aufgenommen werden. Icons ermöglichen es, dass ein Eindruck zu der App übermittelt werden kann. Ein weiteres Feld für Freitext bietet zudem Platz für individuelle Kritik und einer Meinung zu der App. So kann in Zukunft kundennah an der App weiterentwickelt und einfach auf Wünsche und Meinungen reagiert werden.
![](https://data4urbanmobility.l3s.uni-hannover.de/wp-content/uploads/2018/12/menufeedback-1024x910.jpg)
Quantifizierungen und Vorhersage von Auswirkungen von Veranstaltungen
Neue Data4UrbanMobility-Forschungsergebnisse ermöglichen es, die räumlichen Auswirkungen von Veranstaltungen zu quantifizieren und vorherzusagen. Dazu werden zusammenhängende, betroffene Straßenabschnitte in der Nähe von Veranstaltungen identifiziert. Auf dieser Grundlage kann dann die räumliche Auswirkung quantifiziert werden. Das Verfahren ist in der folgenden Grafik dargestellt.
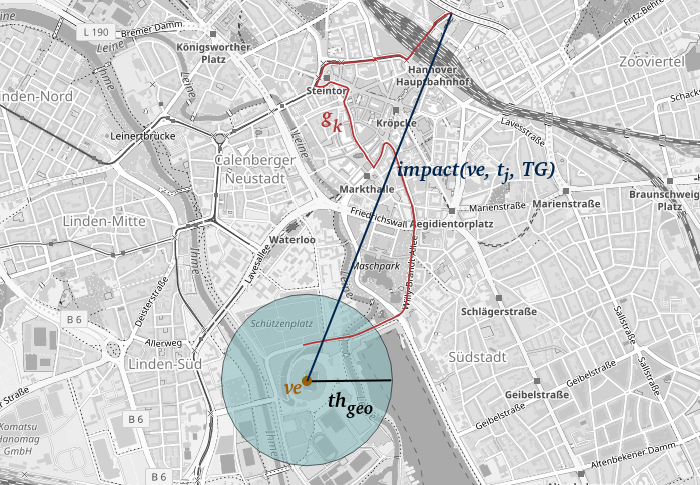
![](https://data4urbanmobility.l3s.uni-hannover.de/wp-content/uploads/2018/06/impact3.png)
Hier in Gelb markiert ist eine Veranstaltung, in Rot betroffene Straßenabschnitte und in Dunkelblau die gemessene Auswirkung. Weiterhin wurden Verfahren des Maschinellen Lernens angewandt, um diese Auswirkungen zu prognostizieren. Dabei konnte der Fehler gegenüber bestehenden state-of-the-art Ansätzen um bis zu 40% verringert werden.
D4UM – Plattform V1 fertiggestellt
Die erste Version der Data4UrbanMobility Plattform wurde fertiggestellt. Dazu wurde zunächst eine 3-Schichten Architektur der Plattform konzipiert und implementiert. Die Plattform bietet RESTfull Webservices für Mobilitätsapplikationen wie Dashboard-Anwendungen oder Apps an. Als erste Beispielanwendung wurde dazu eine interaktive Karte entwickelt, die die Auswirkungen von Veranstaltungen visualisiert. Ein Ausschnitt aus der Anwendung ist im folgenden Screenshot zu sehen.
![](https://data4urbanmobility.l3s.uni-hannover.de/wp-content/uploads/2018/06/Screenshot-from-2018-06-04-15-50-09-1024x475.png)
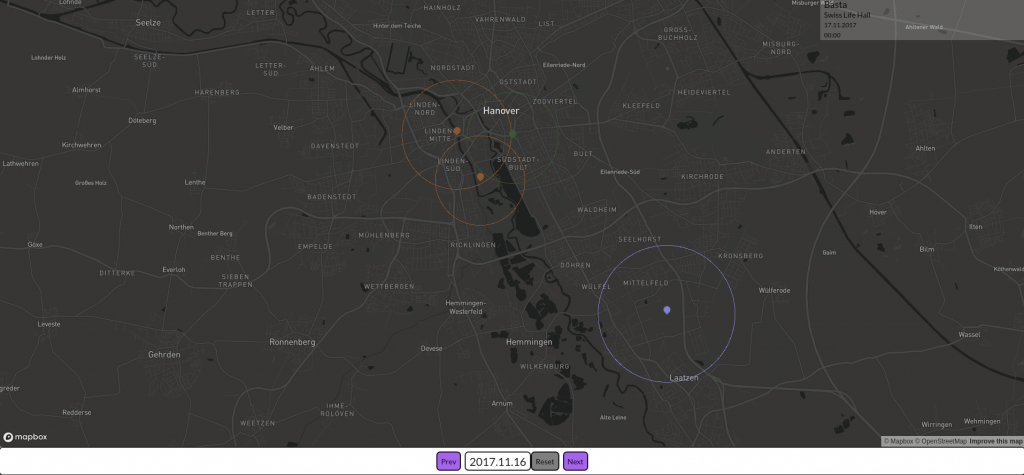
Zu sehen sind 4 Veranstaltungen in Hannover. Die Farben entsprechen dabei unterschiedlichen Veranstaltungsarten (etwa Konzerte, Messen, Fußballspiele). Die Kreise visualisieren die räumlichen Auswirkungen, die diese Veranstaltungen auf den Verkehr hatten.
Umfangreicher Anforderungskatalog
Die Data4UrbanMobility Anforderungsanalyse umfasst die Erfassung der Anforderungen der Anwendungspartner Region Hannover (RH) und Wolfsburg AG (WAG), sowie der nicht-funktionalen Anforderungen. Aus den Anforderungen der AnwendungspartnerInnen (RH und WAG), die von MOMA erhoben wurden, sind von L3S Forschungsfragen für die Datenanalyse abgeleitet worden, die sich speziell auf die Informationsbedürfnisse der AnwenderInnen beziehen und im weiteren Projektverlauf adressiert werden.
Die aktuelle Forschungsfragen adressieren insbesondere:
- Automatische Verifikation von Verkehrswarnmeldungen und Prognose von deren Auswirkungen.
- Identifikation von Veranstaltungen und Prognose verkehrsrelevanter Auswirkungen.
- Korrelation von IV-Reiseflussdaten, EFA-Querylogs, Warnmeldungen und Twitterfeeds.
- Bestimmung von optimalen Reisezeitpunkte.
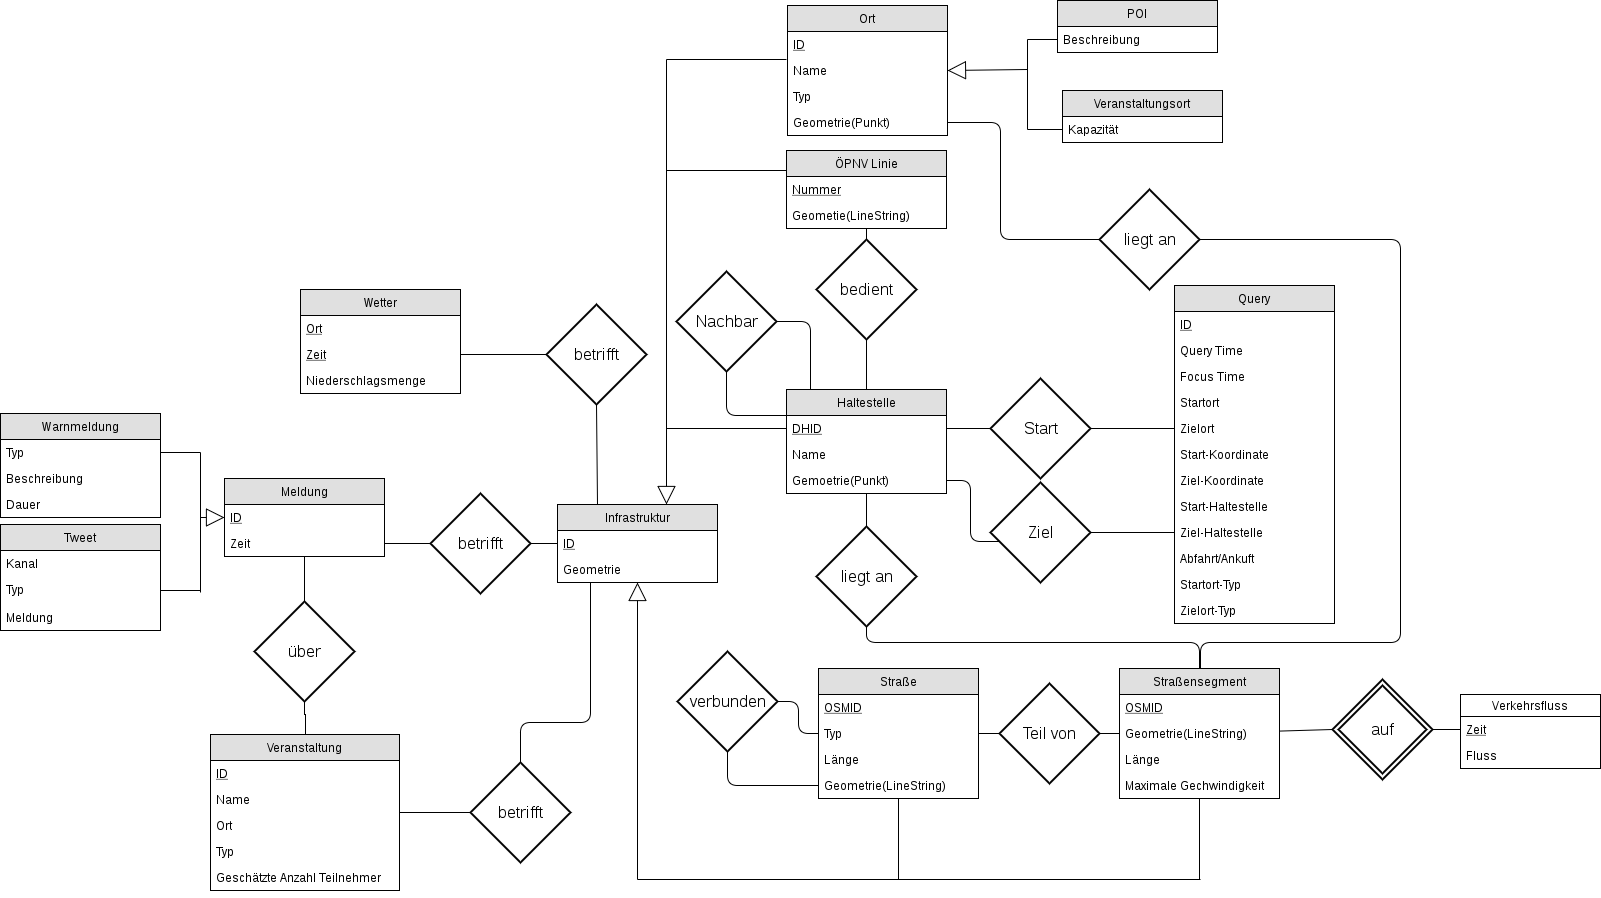
Wachsende Datensammlung
Das ISU hat einen umfassende Datenmatrix mit potentiellen Quellen für mobilitätsrelevante Daten erstellt. Das von L3S entwickelte Data4UrbanMobility Datenmodell beschreibt alle projektrelevanten Daten und setzt diese in Verbindung um die Daten sowohl für die Analyse als auch für die Anwendungen und Apps einheitlich zur Verfügung zu stellen. Die ausgewählten Datenquellen sind von L3S in das Data4UrbanMobility Datenmodell überführt. Einige der Datenquellen wie EFA-logs, und IV-Daten sind dabei auf deren Qualität geprüft worden.
Um die Datenintegration zu ermöglichen sind Werkzeuge zur Extraktion der relevanten Daten aus Mobilitätsrelevanten Datenquellen entwickelt worden:
- Straßen- und Graphextraktion aus OpenStreetMap
- EFA-Anfragen Bulkloader für die Extraktion der ÖPNV Anfragen aus EFA Logs
- Integration von Daten aus dem Zentralen Haltestellen Verzeichnis (ZHV) inklusive Verknüpfung der Daten mit den EFA-Anfragen
Die aktuelle Datensammlung (Stand: 12 Dezember 2017) umfasst:
EFA-Logs: 17 Mio. Suchanfragen
IV-Daten: 174 Tsd. Straßen, alle 15 Minuten
GTFS-Daten: 90 Tsd. Haltestellen, 2,6 Tsd. Routen
Wetter: Radolan Regenraster
Twitter: 2,5 Mio. Tweets ab Juni 2017
OSM: 440 Tsd. Straßen
Events: 21 Tsd. Veranstaltungen (14.08.2016-17.07.2018)
Warnmeldungen: 13 Tsd. Warnmeldungen (ab 06.2017)
Visualisierungen der ÖPNV Informationen
Zur intuitiven Analyse von mobilitätsrelevanten Informationen, insbesondere von ÖPNV Informationen, wurde von den PROJEKTIONISTEN (PROJ) eine Dashboard-Webapplikation konzipiert. Erste Prototypen visualisieren Anfragen an das regionale Fahrplanauskunftsystem EFA (www.efa.de) und dienen als Ausgangsbasis für explorative Analysen und die Implementierung der produktiven Version des Dashboards. Im Folgenden ist eine im Dashboard integrierte Visualisierung der häufigsten Start- und Ziel-punkte zu sehen.
![](https://data4urbanmobility.l3s.uni-hannover.de/wp-content/uploads/2018/01/efa_visual-300x149.png)
Analysen der EFA-Logs
Als erste Forschungsfrage wird aktuell die Analyse der Auswirkungen der Veranstaltungen auf dem ÖPNV mit Methoden des Maschinellen Lernens analysiert. Hierzu wurden in explorativen Datenanalysen der Einfluss von großen Veranstaltungen wie z.B. Fussballspielen und mittelgroßen Veranstaltungen, etwa Konzerte, auf Anfragen an den ÖPNV betrachtet. Als Grundlage für umfassende Analysen wurden mit Hilfe visueller Methoden exemplarisch Korrelation zwischen ÖPNV-Nachfrage und Veranstaltungszeiträumen detektiert.
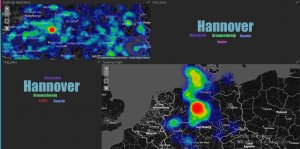
Dabei zeichnen sich z.B. für Hannovers Innenstadt klare, sternförmige Muster ab, die zentrale Mobilitätsknoten identifizieren.
![](https://data4urbanmobility.l3s.uni-hannover.de/wp-content/uploads/2018/01/hubStars-300x240.jpg)
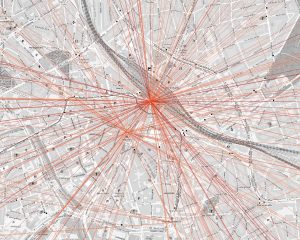
Das Bild stellt die Luftlinie zwischen Start- und Ziel-Ort der Anfragen dar. Dabei entsprechen dunklere Farben häufigeren Strecken. Hier werden deutlich Hannover Hauptbahnhof und Hannover Kröpcke (die zentrale U-Bahn Station) als Mobilitätsknoten identifiziert.
Analysen der Nachfrage für einzelne Stationen lassen wochentagspezifische Muster erkennen.
![](https://data4urbanmobility.l3s.uni-hannover.de/wp-content/uploads/2018/01/zielAvg-300x201.png)
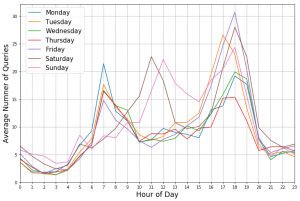
Hier dargestellt sind die durchschnittliche Anzahl der Anfragen mit der Ziel-Haltestelle “Hannover Stadionbrücke”. Zu erkennen sind vor allem Unterschiede zwischen Werktagen und dem Wochenende.
Auch der Einfluss von Veranstaltungen kann mit Hilfe der Anfragen visualisiert werden:
![](https://data4urbanmobility.l3s.uni-hannover.de/wp-content/uploads/2018/01/zielConcert-300x201.png)
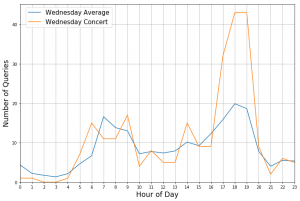
Dargestellt sind die Anzahl der Anfragen mit Ziel “Hannover Stadionbrücke” für Mittwoch, den 26.04.2017 (Orange) sowie die durchschnittlichen Anzahl von Anfragen, die mittwochs mit gleichem Ziel gestellt wird (Blau).
An diesem Tag fand in einer nahe gelegenen Konzerthalle ein Konzert statt, das um 20 Uhr begann. Die signifikante Abweichung zwischen 17 und 19 Uhr wurde sehr wahrscheinlich von den anreisenden Gästen verursacht wurde. Dies illustriert, dass Anfragen an den ÖPNV eine wertvolle Informationsquelle sein können, um Prognosen über die Auswirkung von Veranstaltungen auf Mobilität zu erstellen.
DESI dark secrets. Abreu, Matilde Lopes; Turner, Michael S. (2025).
MirrorCBO: A consensus-based optimization method in the spirit of mirror descent Bungert, Leon; Hoffmann, Franca; Kim, Doh Yeon; Roith, Tim (2025).
On a symplectic quantum Howe duality. Bodish, Elijah; Tubbenhauer, Daniel (2025).
Resting calcium ion fluxes protect cells from fast mitochondrial fragmentation, cell stress responses, and immediate transcriptional reprogramming. Fecher, Caroline; Sodmann, Annemarie; Schlott, Felicitas; Jaepel, Juliane; Schmitt, Franziska; Lengfelder, Isabella; Bischler, Thorsten; Nieswandt, Bernhard; Winklhofer, Konstanze F.; Blum, Robert (2025).
Homeostatic calcium ion (Ca2+) fluxes between the endoplasmic reticulum, cytosol, and extracellular space occur not only in response to cell stimulation but also in unstimulated cells. Using murine astrocytes as a model, we asked whether there is a signaling function of these resting Ca2+-fluxes. The data showed that endoplasmic reticulum (ER) Ca2+ depletion, induced by sarcoplasmic/endoplasmic reticulum Ca2+-ATPase (SERCA) inhibition, resulted to prolonged Ca2+ influx and mitochondrial fragmentation within 10 to 30 minutes. This mitochondrial fragmentation could be prevented in Ca2+-free medium or by inhibiting store-operated Ca2+ entry (SOCE). Similarly, attenuation of STIM proteins, which are vital ER Ca2+ sensors, protected mitochondrial morphology. On the molecular level, ER Ca2+ depletion, achieved either by removing extracellular Ca2+ or through acute SERCA inhibition, led to changes in gene expression of about 13% and 41% of the transcriptome within an hour, respectively. Transcriptome changes were associated with universal biological processes such as transcription, differentiation, or cell stress. Strong increase in expression was observed for the transcription factor ATF4, which is under control of the kinase PERK (EIF2AK3), a key protein involved in ER stress. Corroborating these findings, PERK was rapidly phosphorylated in Ca2+-free medium or after acute pharmacological inhibition of SOCE. In summary, resting, homeostatic Ca2+ fluxes prevent immediate-early cell stress and transcriptional reprogramming.Competing Interest StatementThe authors have declared no competing interest.
Master your practice! A quantitative analysis of Device and system handling training to enable competent interactions with intelligent voice assistants. Maximilian, B.; Markus, A.; Pfister, J.; Carolus, A.; Hotho, A.; Wienrich, C. (2025). 17 100610.
Photofunctional cyclophane host–guest systems. Garain, Swadhin; Würthner, Frank (2025). 61(15) 3081–3092.
Modulation of optical properties through smart protein matrices is exemplified by a few examples in nature such as rhodopsin (absorption wavelength tuning) and the green fluorescence protein (emission), but in general, the scope found in nature for the matrix-controlled photofunctions remains rather limited. In this review, we present cyclophane-based supramolecular host–guest complexes for which electronic interactions between the cyclophane host and mostly planar aromatic guest molecules can actively modulate excited-state properties in a more advanced way involving both singlet and triplet excited states. We begin by highlighting photofunctional host–guest systems for on–off fluorescence switching and chiroptical functions using bay-functionalized perylene bisimide cyclophanes. Next, we examine the impact of π-extension in perylene bisimide cyclophanes for multiple guest binding, showcasing photofunctional properties including circularly polarized luminescence (CPL). We then focus on triplet-generating cyclophanes, i.e. coronene bisimide cyclophane, with high intersystem crossing (ISC) rates, where we demonstrate modulation of excited state pathways upon guest encapsulation and triplet sensitization through phosphorescence and thermally activated delayed fluorescence (TADF). Furthermore, using supramolecular strategies, we advance non-covalent designs, involving either heavy-atom-based Pt(acac)2 guests or heavy-atom free charge transfer complexes, for triplet harvesting under ambient conditions and demonstrate the role of supramolecular nanoenvironments in stabilizing triplet excitons in aerated solutions. Additionally, we showcase examples for triplet–triplet annihilation (TTA) upconversion in defined cyclophane complexes in aqueous solutions and the application of host–guest chemistry in organic light-emitting diodes (OLEDs).
GEE‐PICX: generating cloud‐free Sentinel‐2 and Landsat image composites and spectral indices for custom areas and time frames – a Google Earth Engine web application. Pflumm, Luisa; Kang, Hyeonmin; Wilting, Andreas; Niedballa, Jürgen (2025).
Safer interaction with IVAs: The impact of privacy literacy training on competent use of intelligent voice assistants. Markus, A.; Baumann, M.; Pfister, J.; Carolus, A.; Hotho, A.; Wienrich, C. (2025). 8(100372)
Risk and Reward: Portfolio-based Dynamic Electricity Tariffs for Leveraging Demand-side Flexibility. Ameling, Justus; Gust, Gunther (2025).
DESI dark secrets. Abreu, Matilde Lopes; Turner, Michael S. (2025).
Origin of the non-Fermi-liquid behavior in CeRh\($_\mathbf2$\)As\($_\mathbf2$\). Khanenko, P.; Hafner, D.; Semeniuk, K.; Banda, J.; Lühmann, T.; Bärtl, F.; Kotte, T.; Wosnitza, J.; Zwicknagl, G.; Geibel, C.; Landaeta, J. F.; Khim, S.; Hassinger, E.; Brando, M. (2025). 111(4)
Unconventional superconductivity in heavy-fermion systems appears often near magnetic quantum critical points (QCPs). This seems to be the case also for CeRh2As2 (Tc ≈ 0.31 K). CeRh2As2 shows two superconducting (SC) phases, SC1 and SC2, for a magnetic field along the c axis of the tetragonal unit cell, but only the SC1 phase is observed for a field along the basal plane. Furthermore, another ordered state (phase-I) is observed below T0 ≈ 0.48 K whose nature is still unclear: Thermodynamic and magnetic measurements pointed to a non magnetic multipolar state, but recent μSR and NQR/NMR experiments have clearly detected antiferromagnetic (AFM) order below T0 . Also, quasi-two-dimensional AFM fluctuations were observed in NMR and neutron-scattering experiments above T0. The proximity of a QCP is indicated by non-Fermi-liquid (NFL) behavior observed above the ordered states in both specific heat C(T)/T∝T−0.6 and resistivity ρ(T)∝T0.5. These T-dependencies are not compatible with any generic AFM QCP. Because of the strong magnetic-field anisotropy of both the SC phase and phase I, it is possible to study a field-induced SC QCP as well a phase-I QCP by varying the angle α between the field and the c axis. Thus, by examining the behavior of the electronic specific-heat coefficient C(T)/T across these QCPs, we can determine which phase is associated with the NFL behavior. Here, we present low-temperature specific-heat measurements taken in a magnetic field as high as 21 T applied at several angles α. We observe that the NFL behavior does very weakly depend on the field and on the angle α, a result that is at odd with that observations in standard magnetic QCPs. This suggests a nonmagnetic origin of the quantum critical fluctuations.
Conserving saproxylic flagship species by complementing 150 years of natural history with citizen science data---the case of the stag beetles (Lucanidae, Coleoptera) of Portugal. Soutinho, Jo~ao Gonçalo; Carvalho, Jo~ao; Matos, Milene; Grosso-Silva, José Manuel; Moreira-Pinhal, Tatiana C.; Rego, Carla; Ferreira, Sónia; Abreu, Jo~ao Gonçalo; Gonçalves, Ana Rita; Ceia, Helena; Fonseca, Carlos; Rufino, Cristina; Müller, Jörg; Vierling, Kerri T.; Vierling, Lee A.; Gonçalves, Jo~ao (2025).
The use of flagship species in conservation, such as the European Stag Beetle (Lucanus cervus), can positively affect the conservation of other taxonomic or functionally related species. This is especially true for taxonomic groups where the knowledge regarding their distribution and ecology is generally limited, as is the case of insects. This work represents the most accurate and up-to-date publication on the distribution, ecology and environmental niche of the four lucanids found in Portugal. Moreover, it unravels how citizen science initiatives can positively impact conservation planning for flagship species and their taxonomic and functionally related species. Compared to non-citizen science sources, citizen science data increased the known distribution area for all four species (1.6 to 7.2 fold) and confirmed most of the current known species distribution (50.0\% to 95.5\%). It also expanded the known environmental niche breadth for all species (1.1 to 4.2 fold) and the species suitable modelled habitat (1.1 to 2.1 fold) with very good model performances (AUC\thinspace>\thinspace0.8 and TSS\thinspace>\thinspace0.6). Our results suggest that to improve the conservation of these species, it is paramount to value native forests in Portugal. Management actions to accomplish this might include preserving current native forests and small natural features (such as large old trees) throughout the landscape while simultaneously increasing native forest development. In addition, climate change will affect the species' distribution since all are highly susceptible to specific (bio-)climatic conditions that are expected to change in the next decades. These findings not only enhance our understanding of these species' current distribution but also pave the way for targeted and integrative conservation efforts throughout the country, especially in areas where the (now assessed) ecological niche requirements and habitat availability (either in terms of landscape composition or structure) are met. Guidelines and priorities are discussed on how to implement conservation measures in Portugal following the recently approved European Nature Restoration Law.
Neonatal antipredator tactics shape female movement patterns in large herbivores. Atmeh, Kamal; Bonenfant, Christophe; Gaillard, Jean-Michel; Garel, Mathieu; Hewison, A. J. Mark; Marchand, Pascal; Morellet, Nicolas; Anderwald, Pia; Buuveibaatar, Bayarbaatar; Beck, Jeffrey L.; Becker, Matthew S.; van Beest, Floris M.; Berg, Jodi; Bergvall, Ulrika A.; Boone, Randall B.; Boyce, Mark S.; Chamaillé-Jammes, Simon; Chaval, Yannick; Buyanaa, Chimeddorj; Christianson, David; Ciuti, Simone; Côté, Steeve D.; Diefenbach, Duane R.; Droge, Egil; du Toit, Johan T.; Dwinnell, Samantha; Fennessy, Julian; Filli, Flurin; Fortin, Daniel; Hart, Emma E.; Hayes, Matthew; Hebblewhite, Mark; Heim, Morten; Herfindal, Ivar; Heurich, Marco; von Hoermann, Christian; Huggler, Katey; Jackson, Craig; Jakes, Andrew F.; Jones, Paul F.; Kaczensky, Petra; Kauffman, Matthew; Kjellander, Petter; LaSharr, Tayler; Loe, Leif Egil; May, Roel; McLoughlin, Philip; Meisingset, Erling L.; Merrill, Evelyn; Monteith, Kevin L.; Mueller, Thomas; Mysterud, Atle; Nandintsetseg, Dejid; Olson, Kirk; Payne, John; Pearson, Scott; Pedersen, AAshild Onvik; Ranglack, Dustin; Reinking, Adele K.; Rempfler, Thomas; Rice, Clifford G.; Roskaft, Eivin; Saether, Bernt-Erik; Saïd, Sonia; Santacreu, Hugo; Schmidt, Niels Martin; Smit, Daan; Stabach, Jared A.; St-Laurent, Martin-Hugues; Taillon, Joëlle; Walter, W. David; White, Kevin; Péron, Guillaume; Loison, Anne (2025). 9(1) 142–152.
Caring for newborn offspring hampers resource acquisition of mammalian females, curbing their ability to meet the high energy expenditure of early lactation. Newborns are particularly vulnerable, and, among the large herbivores, ungulates have evolved a continuum of neonatal antipredator tactics, ranging from immobile hider (such as roe deer fawns or impala calves) to highly mobile follower offspring (such as reindeer calves or chamois kids). How these tactics constrain female movements around parturition is unknown, particularly within the current context of increasing habitat fragmentation and earlier plant phenology caused by global warming. Here, using a comparative analysis across 54 populations of 23 species of large herbivores from 5 ungulate families (Bovidae, Cervidae, Equidae, Antilocapridae and Giraffidae), we show that mothers adjust their movements to variation in resource productivity and heterogeneity according to their offspring's neonatal tactic. Mothers with hider offspring are unable to exploit environments where the variability of resources occurs at a broad scale, which might alter resource allocation compared with mothers with follower offspring. Our findings reveal that the overlooked neonatal tactic plays a key role for predicting how species are coping with environmental variation.
Malaria vaccine introduction in Africa: progress and challenges. Impouma, Benido; Adidja, Amani; Mboussou, Franck; Cabore, Joseph; Moeti, Matshidiso (2025). 405(10478) 521–524.
Efficacy and Safety of Glucagon-Like Peptide-1 Receptor Agonists for Weight Loss Among Adults Without Diabetes: A Systematic Review of Randomized Controlled Trials. Moiz, Areesha; Filion, Kristian B.; Toutounchi, Helia; Tsoukas, Michael A.; Yu, Oriana H.Y.; Peters, Tricia M.; Eisenberg, Mark J. (2025).
Sample coverage affects diversity measures of bird communities along a natural recovery gradient of abandoned agriculture in tropical lowland forests. Kortmann, Mareike; Chao, Anne; Schaefer, H. Martin; Blüthgen, Nico; Gelis, Rudy; Tremlett, Constance J.; Busse, Annika; Püls, Marcel; Seibold, Sebastian; Kriegel, Peter; Rabl, Dominik; de la Hoz, Maria; Şekercioğlu, Çağan H.; Schleuning, Matthias; Feldhaar, Heike; Newell, Felicity L.; Kümmet, Sonja; Mitesser, Oliver; Peters, Marcel K.; Müller, Jörg (2025).
Risk response towards roads is consistent across multiple species in a temperate forest ecosystem. Luca Bastianelli, Matteo; von Hoermann, Christian; Kirchner, Katrin; Signer, Johannes; Dupke, Claudia; Henrich, Maik; Wielgus, Elodie; Fiderer, Christian; Belotti, Elisa; Bufka, Luděk; Ciuti, Simone; Dormann, Carsten F.; Kuemmerle, Tobias; Storch, Ilse; Grilo, Clara; Heurich, Marco (2024). 2024(7)
Estimating electrical distribution network length and capital investment needs from real-world topologies and land cover data. Rüde, Lenard; Wussow, Moritz; Heleno, Miguel; Gust, Gunther; Neumann, Dirk (2024). 195 114368.
Red fox cannibalism in a temperate forest ecosystem. Muther, Sandrina; Premier, Joe; Gahbauer, Martin; von Hoermann, Christian; Müller, Jörg; Heurich, Marco (2024). 77 8–15.
Spatio-temporal Pricing and Fleet Management under Mixed Autonomy. Ubeda, Ignacio; Gust, Gunther (2024).
Designing electricity distribution networks: The impact of demand coincidence. Gust, Gunther; Schlüter, Alexander; Feuerriegel, Stefan; Úbeda, Ignacio; Lee, Jonathan T; Neumann, Dirk (2024). 315(1) 271–288.
Effects of AI understanding-training on AI literacy, usage, self-determined interactions, and anthropomorphization with voice assistants. Markus, A.; Pfister, J.; Carolus, C.; Hotho, A.; Wienrich, C. (2024). 6(1) 100176.
Automated feeder routing for underground electricity distribution networks based on aerial images. Ameling, Justus; Gust, Gunther (2024).
Multi-period electricity distribution network investment planning under demand coincidence in the smart grid. Rüde, Lenard; Gust, Gunther; Neumann, Dirk (2024). 1–24.
Assessing the suitability of a one-time sampling event for close-kin mark-recapture: A caribou case study. Merriell, Brandon D.; Manseau, Micheline; Wilson, Paul J. (2024). 14(9) e70230.
Abstract Abundance estimation is frequently an objective of conservation and monitoring initiatives for threatened and other managed populations. While abundance estimation via capture–mark–recapture or spatially explicit capture–recapture is now common, such approaches are logistically challenging and expensive for species such as boreal caribou (Rangifer tarandus), which inhabit remote regions, are widely dispersed, and exist at low densities. Fortunately, the recently developed ‘close-kin mark–recapture’ (CKMR) framework, which uses the number of kin pairs obtained within a sample to generate an abundance estimate, eliminates the need for multiple sampling events. As a result, some caribou managers are interested in using this method to generate an abundance estimate from a single, non-invasive sampling event for caribou populations. We conducted a simulation study using realistic boreal caribou demographic rates and population sizes to assess how population size and the proportion of the population surveyed impact the accuracy and precision of single-survey CKMR-based abundance estimates. Our results indicated that abundance estimates were biased and highly imprecise when very small proportions of the population were sampled, regardless of the population size. However, the larger the population size, the smaller the required proportion of the population surveyed to generate both accurate and reasonably precise estimates. Additionally, we also present a case study in which we used the CKMR framework to generate annual female abundance estimates for a small caribou population in Jasper National Park, Alberta, Canada, from 2006 to 2015 and compared them to existing published capture–mark–recapture-based estimates. Both the accuracy and precision of the annual CKMR-based abundance estimates varied across years and were sensitive to the proportion of pairwise kinship comparisons which yielded a mother–offspring pair. Taken together, our study demonstrates that it is possible to generate CKMR-based abundance estimates from a single sampling event for small caribou populations, so long as a sufficient sampling intensity can be achieved.
Deep Learning: Foundations and Concepts Bishop, Christopher M.; Bishop, Hugh (2024). Springer International Publishing.
Empower the user - The impact of functional understanding training on usage, social perception, and self-determined interactions with intelligent voice assistants. Markus, A.; Pfister, J.; Carolus, A.; Hotho, A.; Wienrich, C. (2024). 6 100229.
Upscaling biodiversity monitoring: Metabarcoding estimates 31,846 insect species from Malaise traps across Germany. Buchner, Dominik; Sinclair, James S.; Ayasse, Manfred; Beermann, Arne J.; Buse, Jörn; Dziock, Frank; Enss, Julian; Frenzel, Mark; Hörren, Thomas; Li, Yuanheng; Monaghan, Michael T.; Morkel, Carsten; Müller, Jörg; Pauls, Steffen U.; Richter, Ronny; Scharnweber, Tobias; Sorg, Martin; Stoll, Stefan; Twietmeyer, Sönke; Weisser, Wolfgang W.; Wiggering, Benedikt; Wilmking, Martin; Zotz, Gerhard; Gessner, Mark O.; Haase, Peter; Leese, Florian (2024). 25(1)
The neuropeptide pigment-dispersing factor signals independently of Bruchpilot-labelled active zones in daily remodelled terminals of Drosophila clock neurons. Hofbauer, Benedikt; Zandawala, Meet; Reinhard, Nils; Rieger, Dirk; Werner, Christian; Evers, Jan Felix; Wegener, Christian (2024). 59(10) 2665–2685.
The small ventrolateral neurons (sLNvs) are key components of the central clock in the Drosophila brain. They signal via the neuropeptide pigment-dispersing factor (PDF) to align the molecular clockwork of different central clock neurons and to modulate downstream circuits. The dorsal terminals of the sLNvs undergo daily morphological changes that affect presynaptic sites organised by the active zone protein Bruchpilot (BRP), a homolog of mammalian ELKS proteins. However, the role of these presynaptic sites for PDF release is ill-defined. Here, we combined expansion microscopy with labelling of active zones by endogenously tagged BRP to examine the spatial correlation between PDF-containing dense-core vesicles and BRP-labelled active zones. We found that the number of BRP-labelled puncta in the sLNv terminals was similar while their density differed between Zeitgeber time (ZT) 2 and 14. The relative distance between BRP- and PDF-labelled puncta was increased in the morning, around the reported time of PDF release. Spontaneous dense-core vesicle release profiles of sLNvs in a publicly available ssTEM dataset (FAFB) consistently lacked spatial correlation to BRP-organised active zones. RNAi-mediated downregulation of brp and other active zone proteins expressed by the sLNvs did not affect PDF-dependent locomotor rhythmicity. In contrast, down-regulation of genes encoding proteins of the canonical vesicle release machinery, the dense-core vesicle-related protein CADPS, as well as PDF impaired locomotor rhythmicity. Taken together, our study suggests that PDF release from the sLNvs is independent of BRP-organised active zones, while BRP may be redistributed to active zones in a time-dependent manner.
Messung, Modellierung und Vorhersage der Netzwerkqualität mit Fokus auf das Internet der Dinge (IoT). Technical Report (PhD dissertation), Herrnleben, Stefan (2024).
Effects of species traits on the catchability of butterflies with different types of Malaise traps and implications for total catch biomass. Hoffmann, Lara; Palt, Martin; Mignien, Lucas; Uhler, Johannes; Haase, Peter; Müller, Jörg; Stoll, Stefan (2024). 29(1) 8.
Increasing evidence for insect biodiversity decline requires an identification of the causes but also an improved understanding of the limitations of the various underlying sampling methods. Trap comparisons foster comparability of larger-scale biodiversity studies by providing a deeper understanding of the variations in species abundances and trait compositions due to variations in trap characteristics. In our study, we compared five Malaise trap types on their catchability of butterfly species and noctuid moths and examined for the butterflies how this can be related to traits. We showed marked differences in species and trait occurrence in the samples of the different trap types which seemed to be influenced by roof colour (white, black) and trap shape (Townes trap: high, wide roof, Bartak trap: low, narrow roof). We found most butterfly species and most butterfly biomass in the white-roofed Townes trap. All butterfly traits were represented with most individuals in this trap. Compared with its black counterpart, it showed increased catches for pale butterflies and forest species. We found that dark-roofed traps captured fewer butterfly species and had a lower butterfly biomass. Townes traps captured more butterflies with larger wingspans, egg-laying locations higher above ground, and tree feeding behaviour compared to Bartak traps. Depending on the season and habitat, the differences in species capture may affect overall insect biomass.
Development of Peptide-Based Probes for Molecular Imaging of the Postsynaptic Density in the Brain. Fernandes, Eduardo F. A.; Palner, Mikael; Raval, Nakul Ravi; Jeppesen, Troels E.; Danková, Daniela; Bærentzen, Simone L.; Werner, Christian; Eilts, Janna; Maric, Hans M.; Doose, Sören; Aripaka, Sanjay Sagar; Kaalund, Sanne Simone; Aznar, Susana; Kjaer, Andreas; Schlosser, Andreas; Haugaard-Kedström, Linda M.; Knudsen, Gitte M.; Herth, Matthias M.; Stro̷mgaard Kristian (2024). 67(14) 11975–11988.
The postsynaptic density (PSD) comprises numerous scaffolding proteins, receptors, and signaling molecules that coordinate synaptic transmission in the brain. Postsynaptic density protein 95 (PSD-95) is a master scaffold protein within the PSD and one of its most abundant proteins and therefore constitutes a very attractive biomarker of PSD function and its pathological changes. Here, we exploit a high-affinity inhibitor of PSD-95, AVLX-144, as a template for developing probes for molecular imaging of the PSD. AVLX-144-based probes were labeled with the radioisotopes fluorine-18 and tritium, as well as a fluorescent tag. Tracer binding showed saturable, displaceable, and uneven distribution in rat brain slices, proving effective in quantitative autoradiography and cell imaging studies. Notably, we observed diminished tracer binding in human post-mortem Parkinson’s disease (PD) brain slices, suggesting postsynaptic impairment in PD. We thus offer a suite of translational probes for visualizing and understanding PSD-related pathologies.
Ground‐dwelling mammal and bird diversity in the southern Annamites: Exploring complex habitat associations and the ghost of past hunting pressure. Nguyen, An; Tilker, Andrew; Le, Duy; Niedballa, Jürgen; Pflumm, Luisa; Pham, Xuan Hoan; Le, Van Son; Luu, Hong Truong; Tran, Van Bang; Kramer‐Schadt, Stephanie; Sollmann, Rahel; Wilting, Andreas (2024). 6(4)
3D Analytics: Opportunities and Guidelines for Information Systems Research. Gust, Gunther; Brandt, Tobias; Koppius, Otto; Rosenfelder, Markus; Neumann, Dirk (2023).
Provectories: Embedding-Based Analysis of Interaction Provenance Data. Walchshofer, Conny; Hinterreiter, Andreas; Xu, Kai; Stitz, Holger; Streit, Marc (2023). 29(12) 4816–4831.
Understanding user behavior patterns and visual analysis strategies is a long-standing challenge. Existing approaches rely largely on time-consuming manual processes such as interviews and the analysis of observational data. While it is technically possible to capture a history of user interactions and application states, it remains difficult to extract and describe analysis strategies based on interaction provenance. In this article, we propose a novel visual approach to the meta-analysis of interaction provenance. We capture single and multiple user sessions as graphs of high-dimensional application states. Our meta-analysis is based on two different types of two-dimensional embeddings of these high-dimensional states: layouts based on (i) topology and (ii) attribute similarity. We applied these visualization approaches to synthetic and real user provenance data captured in two user studies. From our visualizations, we were able to extract patterns for data types and analytical reasoning strategies.
Long-Term Effects of Perceived Friendship with Intelligent Voice Assistants on Usage Behavior, User Experience, and Social Perceptions. Wienrich, C.; Carolus, A.; Markus, A.; Augustin, Y.; Pfister, J.; Hotho, A. (2023). 12(4) 77.
Neural Model-Applying Network (Neuman): A New Basis for Computational Cognition. Roth, Frederick T. Ray, R. A. Sarker, X. Li (eds.) (2023).
Reliable route planning and time savings in real-world urban intermodal transportation networks: Evidence from Hamburg, Germany. Ruß, Matthias; Gust, Gunther (2023). 227 120196.
Subproject B2: Configuration and Evaluation. Hanselle, Jonas Manuel; Hüllermeier, Eyke; Mohr, Felix; Ngonga Ngomo, Axel-Cyrille; Sherif, Mohamed Ahmed; Tornede, Alexander; Wever, Marcel Dominik C.-J. Haake, F. Meyer auf der Heide, M. Platzner, H. Wachsmuth, H. Wehrheim (eds.) (2023). (Vol. 412) 85–104.
Extremely sparse models of linkage disequilibrium in ancestrally diverse association studies. Salehi Nowbandegani, Pouria; Wohns, Anthony Wilder; Ballard, Jenna L.; Lander, Eric S.; Bloemendal, Alex; Neale, Benjamin M.; O’Connor, Luke J. (2023). 55(9) 1494–1502.
Linkage disequilibrium (LD) is the correlation among nearby genetic variants. In genetic association studies, LD is often modeled using large correlation matrices, but this approach is inefficient, especially in ancestrally diverse studies. In the present study, we introduce LD graphical models (LDGMs), which are an extremely sparse and efficient representation of LD. LDGMs are derived from genome-wide genealogies; statistical relationships among alleles in the LDGM correspond to genealogical relationships among haplotypes. We published LDGMs and ancestry-specific LDGM precision matrices for 18 million common variants (minor allele frequency >1\%) in five ancestry groups, validated their accuracy and demonstrated order-of-magnitude improvements in runtime for commonly used LD matrix computations. We implemented an extremely fast multiancestry polygenic prediction method, BLUPx-ldgm, which performs better than a similar method based on the reference LD correlation matrix. LDGMs will enable sophisticated methods that scale to ancestrally diverse genetic association data across millions of variants and individuals.
AI Literacy: Kompetenzdimensionen und Einflussfaktoren im Kontext von Arbeit Wienrich, C.; Carolus, A.; Markus, A.; Augustin, Y. (2022). (Vol. 1) 1–24.
Digital interaction literacy model. Conceptualizing competencies for literate interactions with voice-based AI systems. Carolus, A.; Augustin, Y.; Markus, A.; Wienrich, C. (2022). 100114.
3D-PV-Locator: Large-scale detection of rooftop-mounted photovoltaic systems in 3D. Mayer, Kevin; Rausch, Benjamin; Arlt, Marie-Louise; Gust, Gunther; Wang, Zhecheng; Neumann, Dirk; Rajagopal, Ram (2022). 310 118469.
Welcome message from the organizers. Weidlich, Anke; Neumann, Dirk; Staudt, Philipp; Gust, Gunther; Schäfer, Mirko (2021). 1–2.
The constrained reliable shortest path problem in stochastic time-dependent networks. Ruß, Matthias; Gust, Gunther; Neumann, Dirk (2021). 69(3) 709–726.
Predicting residential electricity consumption using aerial and street view images. Rosenfelder, Markus; Wussow, Moritz; Gust, Gunther; Cremades, Roger; Neumann, Dirk (2021). 301 117407.
Strategies for microgrid operation under real-world conditions. Gust, Gunther; Brandt, Tobias; Mashayekh, Salman; Heleno, Miguel; DeForest, Nicholas; Stadler, Michael; Neumann, Dirk (2021). 292(1) 339–352.
Anti–contactin-1 Antibodies Affect Surface Expression and Sodium Currents in Dorsal Root Ganglia. Grüner, Julia; Stengel, Helena; Werner, Christian; Appeltshauser, Luise; Sommer, Claudia; Villmann, Carmen; Doppler, Kathrin (2021). 8(5) e1056-.
Background and Objectives: As autoantibodies to contactin-1 from patients with chronic inflammatory demyelinating polyradiculoneuropathy not only bind to the paranodes where they are supposed to cause conduction failure but also bind to other neuronal cell types, we aimed to investigate the effect of anti–contactin-1 autoantibodies on contactin-1 surface expression in cerebellar granule neurons, dorsal root ganglion neurons, and contactin-1–transfected human embryonic kidney 293 cells. Methods: Immunocytochemistry including structured illumination microscopy and immunoblotting was used to determine expression levels of contactin-1 and/or sodium channels after long-term exposure to autoantibodies from 3 seropositive patients. For functional analysis of sodium channels, whole-cell recordings of sodium currents were performed on dorsal root ganglion neurons incubated with anti–contactin-1 autoantibodies. Results: We found a reduction in contactin-1 expression levels on dorsal root ganglion neurons, cerebellar granule neurons, and contactin-1–transfected human embryonic kidney 293 cells and decreased dorsal root ganglion sodium currents after long-term exposure to anti–contactin-1 autoantibodies. Sodium channel density did not decrease. Discussion: Our results demonstrate a direct effect of anti–contactin-1 autoantibodies on the surface expression of contactin-1 and sodium currents in dorsal root ganglion neurons. This may be the pathophysiologic correlate of sensory ataxia reported in these patients.
An enriched automated PV registry: Combining image recognition and 3D building data. Rausch, Benjamin; Mayer, Kevin; Arlt, Marie-Louise; Gust, Gunther; Staudt, Philipp; Weinhardt, Christof; Neumann, Dirk; Rajagopal, Ram (2020).
AN ANALYSIS OF SURFACE AND GROWTH DIFFERENCES IN PLANTS OF DIFFERENT STAGES USING IMAGE PROCESSING . Rashid, Faizur; Delesa, Tamirat (F. Rashid; T. Delesa, eds.) (2019). 9(4) 7.
Genomes are main reason for growth and surface differences in the plants. All plants grow on basis of their different surrounding like soil, water, breed of seed, and climatic session. This paper attempts to find stem growth from birth to maturity level of selected plant using image processing technique. Few reasons have been observed commonly by the researchers that some plants could not grow sufficiently as to the other plants of similar breed and age. Images were taken of different stage of bean plant and images of some other plant samples were also included for better assessment. Researchers are trying to understand through their calculative analysis by image processing emulator in MATLAB to view its reasons. Suitable comparison technique is applied to detect their period of growth. Image processing methods like Restoration, stem or leaves spots, filtering, and plant comparison have applied in MATLAB. Those effects that are not supporting to grow the plants of their similar age group are matter to calculate scientifically later in the future. The observation would help for further support in medicinal science or agricultural science of plant and Bio-chemical.
Robust Route Planning in Intermodal Urban Traffic. Ruß, Matthias; Gust, Gunther; Neumann, Dirk (2019).
Anti-CNTN1 IgG3 induces acute conduction block and motor deficits in a passive transfer rat model. Doppler, Kathrin; Schuster, Yasmin; Appeltshauser, Luise; Biko, Lydia; Villmann, Carmen; Weishaupt, Andreas; Werner, Christian; Sommer, Claudia (2019). 16(1) 73-.
Autoantibodies against the paranodal protein contactin-1 have recently been described in patients with severe acute-onset autoimmune neuropathies and mainly belong to the IgG4 subclass that does not activate complement. IgG3 anti-contactin-1 autoantibodies are rare, but have been detected during the acute onset of disease in some cases. There is evidence that anti-contactin-1 prevents adhesive interaction, and chronic exposure to anti-contactin-1 IgG4 leads to structural changes at the nodes accompanied by neuropathic symptoms. However, the pathomechanism of acute onset of disease and the pathogenic role of IgG3 anti-contactin-1 is largely unknown.
Triangulated categories of mixed motives. Cisinski, Denis-Charles; Déglise, Frédéric (2019).
Competence, Fashion and the Case of Blockchain. Albrecht, Simon; Gust, Gunther; Strüker, Jens; Neumann, Dirk (2019).
Fast Model-Fitting of Bayesian Variable Selection Regression Using the Iterative Complex Factorization Algorithm. Zhou, Quan; Guan, Yongtao (2019). 14(2) 573–594.
Bayesian variable selection regression (BVSR) is able to jointly analyze genome-wide genetic datasets, but the slow computation via Markov chain Monte Carlo (MCMC) hampered its wide-spread usage. Here we present a novel iterative method to solve a special class of linear systems, which can increase the speed of the BVSR model-fitting tenfold. The iterative method hinges on the complex factorization of the sum of two matrices and the solution path resides in the complex domain (instead of the real domain). Compared to the Gauss-Seidel method, the complex factorization converges almost instantaneously and its error is several magnitude smaller than that of the Gauss-Seidel method. More importantly, the error is always within the pre-specified precision while the Gauss-Seidel method is not. For large problems with thousands of covariates, the complex factorization is 10–100 times faster than either the Gauss-Seidel method or the direct method via the Cholesky decomposition. In BVSR, one needs to repetitively solve large penalized regression systems whose design matrices only change slightly between adjacent MCMC steps. This slight change in design matrix enables the adaptation of the iterative complex factorization method. The computational innovation will facilitate the wide-spread use of BVSR in reanalyzing genome-wide association datasets.
Management’s IT Competence in turbulent Market Environments. Albrecht, Simon; Gust, Gunther; Strüker, Jens; Neumann, Dirk (2019).
Decision Support for Real Estate Investors: Improving Real Estate Valuation with 3D City Models and Points of Interest. Rosenfelder, Markus; Gust, Gunther; Neumann, Dirk (2019). 482.
The Announcement Effect: The Dependency of Demand Response on Timely Information and the Impact on Efficient System Operation. Arlt, Marie-Louise; Gust, Gunther; Neumann, Dirk (2018).
Multi-period planning of distribution grid reinforcements under uncertainty about future penetration of photovoltaic systems. Dimitrov, Ivan; Gust, Gunther; Brandt, Tobias; Biener, Wolfgang; Neumann, Dirk (2018). 1–6.
Essential formulae for restricted maximum likelihood and its derivatives associated with the linear mixed models. Zhu, Shengxin; Wathen, Andrew J (2018).
The restricted maximum likelihood method enhances popularity of maximum likelihood methods for variance component analysis on large scale unbalanced data. As the high throughput biological data sets and the emerged science on uncertainty quantification, such a method receives increas- ing attention. Estimating the unknown variance parameters with restricted maximum likelihood method usually requires an nonlinear iterative method. Therefore proper formulae for the log- likelihood function and its derivatives play an essential role in practical algorithm design. It is our aim to provide a mathematical introduction to this method, and supply a self-contained derivation on some available formulae used in practical algorithms. Some new proof are supplied.
Quantification of sweat gland innervation in patients with Fabry disease: A case-control study. Kokotis, Panagiotis; Üçeyler, Nurcan; Werner, Christian; Tsivgoulis, Georgios; Papanikola, Nektaria; Katsanos, Aristeidis H.; Karandreas, Nikos; Sommer, Claudia (2018). 390 135–138.
Hypohidrosis and heat intolerance, frequently reported by men and women with Fabry disease (FD), is thought to be related not only to the deposition of globotriaosylceramide (Gb3) in eccrine sweat glands, but also to reduced sweat gland sympathetic innervation. Methods We performed a case-control study to compare the density of sweat gland innervation between patients with FD and healthy controls by examining lower leg skin punch biopsies. We used a standardized grid of circles superimposed upon the immunofluorescent specimen to create a simple pattern of circles over the sweat gland. Nerve fibers that crossed within the circles were manually counted (“crossed circles”). Nerve fibers that touched the edge of the circle but did not enter were spared (“uncrossed circles”). The percentage of crossed circles from all circles was determined. Results Biopsy specimens were available of 37 FD patients (median age 44 years, 19–67; n = 18 men) and 16 controls (median age 48 years, 24–83, n = 7 men). Totally there were 153 sweat glands from FD patients and 63 from controls, in which innervation was quantified. While mean sweat gland innervation per biopsy did not differ between the entire FD cohort and controls, data stratification for the reported sweating phenotype revealed a stepwise lower innervation in women with FD and hypohidrosis (n.s.) and anhidrosis (p < .05) compared to women reporting normal sweating. Conclusion Sweat gland innervation is reduced in women with FD and anhidrosis compared to female patients without sweating impairment. Loss of sweat gland innervation may play a role in FD associated anhidrosis, at least in women.
Analytical Information Systems for the Planning and Operation of Decentralized Electricity Networks. Technical Report (PhD dissertation), Gust, Gunther (2018).
How a traditional company seeded new analytics capabilities. Gust, Gunther; Neumann, Dirk; Flath, Christoph M; Brandt, Tobias; Ströhle, Philipp (2017). 16(3) 215–230.
Defective synaptic transmission causes disease signs in a mouse model of juvenile neuronal ceroid lipofuscinosis. Grünewald, Benedikt; Lange, Maren D; Werner, Christian; O’Leary, Aet; Weishaupt, Andreas; Popp, Sandy; Pearce, David A; Wiendl, Heinz; Reif, Andreas; Pape, Hans C; Toyka, Klaus V; Sommer, Claudia; Geis, Christian (C. Rosenmund, ed.) (2017). 6 e28685-.
Juvenile neuronal ceroid lipofuscinosis (JNCL or Batten disease) caused by mutations in the CLN3 gene is the most prevalent inherited neurodegenerative disease in childhood resulting in widespread central nervous system dysfunction and premature death. The consequences of CLN3 mutation on the progression of the disease, on neuronal transmission, and on central nervous network dysfunction are poorly understood. We used Cln3 knockout (Cln3Δex1-6) mice and found increased anxiety-related behavior and impaired aversive learning as well as markedly affected motor function including disordered coordination. Patch-clamp and loose-patch recordings revealed severely affected inhibitory and excitatory synaptic transmission in the amygdala, hippocampus, and cerebellar networks. Changes in presynaptic release properties may result from dysfunction of CLN3 protein. Furthermore, loss of calbindin, neuropeptide Y, parvalbumin, and GAD65-positive interneurons in central networks collectively support the hypothesis that degeneration of GABAergic interneurons may be the cause of supraspinal GABAergic disinhibition.
Impact of the nominal and real peak power of PV systems on grid reinforcement. Killinger, Sven; Biener, Wolfgang; Gust, Gunther; Wille-Haussmann, Bernhard (2016). 1–6.
Evaluation of methods for estimating distribution grid stress due to future installations of photovoltaic units. Biener, Wolfgang; Gunther, Gunther; Killinger, Sven; Wille-Haussmann, Bernhard (2016). 1780–1783.
Visual Analytics: Data, Analytical and Reasoning Provenance. Varga, Margaret; Varga, Caroline V. L. Lemieux (ed.) (2016). 141–150.
Analysts and decision makers are increasingly overloaded with vast amounts of data/information which are often dynamic, complex, disparate, conflicting, incomplete and, at times, uncertain. Furthermore, problems and tasks that require their attention can be ambiguous, i.e. they are ill-defined. In order to make sense of complex data and situations and make informed decisions, they utilize their intuition, knowledge and experience. Provenance is fundamental for the user to capture and exploit effectively the explicit data and implicit knowledge within the decision making process. Provenance can usefully be considered at three conceptual levels, namely: data (what), analytical (how) and reasoning (why). This paper explores visual analytics in the exploitation of provenance within the decision making process.
Bringing analytics into practice: evidence from the power sector. Gust, Gunther; Flath, Christoph; Brandt, Tobias; Ströhle, Philipp; Neumann, Dirk (2016).
WEB SERVICE COMPOSITION PROCESSES: A COMPARATIVE STUDY. AlSedrani, Aram; Touir, Ameur (2016). 7(1) 01–21.
Service composition is the process of constructing new services by combining several existing ones. It considered as one of the complex challenges in distributed and dynamic environment. The composition process includes, in general, the searching for existing services in a specific domain, and selecting the appropriate service, then coordinating composition flow and invoking services. Over the past years, the problem of web service composition has been studied intensively by researchers. Therefore, a significant amount of solutions and new methods to tackle this problem are presented. In this paper, our objective is to investigate algorithms and methodologies to provide a classification of existing methods in each composition phase. Moreover, we aim at conducting a comparative study to discover the main features and limitation in each phase in order to assist future research in this area.
Enhancing municipal analytics capabilities to enable sustainable urban transportation. Willing, Christoph; Gust, Gunther; Brandt, Tobias; Schmidt, Stefanie; Neumann, Dirk (2016).
A NOVEL APPROACH FOR PERFORMANCE ENHANCEMENT OF E-COMMERCE SOLUTIONS BY FRIENDS RECOMMENDATION SYSTEM AND NEO4J DATABASE. Li, Hongzhou; Zhang, Ji; Luo, Yonglong; Chen, Fulong; Chang, Liang in Lecture Notes in Computer Science, T. Ray, R. A. Sarker, X. Li (eds.) (2016). (Vol. 9592) 125–133.
Decision support for distribution grid planning. Gust, Gunther; Biener, Wolfgang; Brandt, Tobias; Dallmer-Zerbe, Kilian; Neumann, Dirk; Wille-Haussmann, Bernhard (2016). 1–7.
Training Deep Nets with Sublinear Memory Cost. Chen, Tianqi; Xu, Bing; Zhang, Chiyuan; Guestrin, Carlos (2016).
Stiff person-syndrome IgG affects presynaptic GABAergic release mechanisms. Werner, Christian; Haselmann, Holger; Weishaupt, Andreas; Toyka, Klaus V.; Sommer, Claudia; Geis, Christian (2015). 122(3) 357–362.
The majority of patients with stiff person-syndrome (SPS) are characterized by autoantibodies to glutamate decarboxylase 65 (GAD65). In previous passive-transfer studies, SPS immunoglobulin G (IgG) induced SPS core symptoms. We here provide evidence that SPS-IgG causes a higher frequency of spontaneous vesicle fusions. Sustained GABAergic transmission and presynaptic GABAergic vesicle pool size remained unchanged. Since these findings cannot be attributed to anti-GAD65 autoantibodies alone, we propose that additional autoantibodies with so far undefined antigen specificity might affect presynaptic release mechanisms.
Exploiting analysis history to support collaborative data analysis. Sarvghad, Ali; Tory, Melanie in GI ’15 (2015). 123–130.
Coordination is critical in distributed collaborative analysis of multidimensional data. Collaborating analysts need to understand what each person has done and what avenues of analysis remain uninvestigated in order to effectively coordinate their efforts. Although visualization history has the potential to communicate such information, common history representations typically show sequential lists of past work, making it difficult to understand the analytic coverage of the data dimension space (i.e. which data dimensions have been investigated and in what combinations). This makes it difficult for collaborating analysts to plan their next steps, particularly when the number of dimensions is large and team members are distributed. We introduce the notion of representing past analysis history from a dimension coverage perspective to enable analysts to see which data dimensions have been explored in which combinations. Through two user studies, we investigated whether 1) a dimension oriented view improves understanding of past coverage information, and 2) the addition of dimension coverage information aids coordination. Our findings demonstrate that a representation of dimension coverage reduces the time required to identify and investigate unexplored regions and increases the accuracy of this understanding. In addition, it results in a larger overall coverage of the dimension space, one element of effective team coordination.
Automated distribution grid planning considering Smart Grid and conventional grid reinforcement technologies. Biener, Wolfgang; Dallmer-Zerbe, Kilian; Krug, Benjamin; Gust, Gunther; Wille-Haussmann, Bernhard (2015). 1–6.
Interactions of Human Autoantibodies with Hippocampal GABAergic Synaptic Transmission – Analyzing Antibody-Induced Effects ex vivo. Haselmann, Holger; Röpke, Luise; Werner, Christian; Kunze, Albrecht; Geis, Christian (2015). 6
Autoantibodies (aAB) to the presynaptic located enzyme glutamate decarboxylase 65 (GAD65) are a characteristic attribute for a variety of autoimmune diseases of the central nervous system including subtypes of limbic encephalitis, stiff person-syndrome, cerebellar ataxia, and Batten’s disease. Clinical signs of hyperexcitability and improvement of disease symptoms upon immunotherapy in some of these disorders suggest a possible pathogenic role of associated aAB. Recent experimental studies report inconsistent results regarding a direct pathogenic influence of anti-GAD65 aAB affecting inhibitory synaptic transmission in central GABAergic pathways. We here provide a method for direct evaluation of aAB-induced pathomechanisms in the intact hippocampal network. Purified patient IgG fractions containing aAB to GAD65 together with fixable lipophilic styryl dyes (FMdyes) are stereotactically injected into the hilus and the dentate gyrus in anesthetized mice. Twenty-four hours after intrahippocampal injection, acute hippocampal slices are prepared and transferred to a patch-clamp recording setup equipped with a fluorescence light source. Intraneural incorporated FMdyes show correct injection site for patch-clamp recording. Whole-cell patch-clamp recordings are performed from granule cells in the dentate gyrus and extracellular stimulation is applied in the border area of the dentate gyrus-hilus region to stimulate GABAergic afferents arising from parvalbumin positive basket cells. GABA-A receptor mediated inhibitory postsynaptic currents (IPSC) and miniature IPSC are recorded after blocking glutamatergic transmission. This approach allows investigation of potential aAB-induced effects on GABA-A receptor signaling ex vivo in an intact neuronal network. This offers several advantages compared to experimental procedures used in previous studies by in vitro AB preincubation of primary neurons or slice preparations. Furthermore, this method requires only small amounts of patient material that are often limited in rare diseases.
Analyse von Niederspannungsnetzen und Entwicklung von Referenznetzen. Technical Report (PhD dissertation), Gust, Gunther (2014).
Genome-wide efficient mixed-model analysis for association studies. Zhou, Xiang; Stephens, Matthew (2012). 44(7) 821–824.
Matthew Stephens and Xiang Zhou report an efficient exact method for accounting for population stratification and relatedness in genome-wide association analyses. Their method, genome-wide efficient mixed-model association (GEMMA) is implemented in freely available software.
Improved linear mixed models for genome-wide association studies. Listgarten, Jennifer; Lippert, Christoph; Kadie, Carl M; Davidson, Robert I; Eskin, Eleazar; Heckerman, David (2012). 9(6) 525–526.
Top Manufacturer of Orthocoir Sheets, Coir Cake & China Coir. Coir, We (W. Coir, ed.) (2012).
GCTA: A Tool for Genome-wide Complex Trait Analysis. Yang, Jian; Lee, S. Hong; Goddard, Michael E.; Visscher, Peter M. (2011). 88(1) 76–82.
For most human complex diseases and traits, SNPs identified by genome-wide association studies (GWAS) explain only a small fraction of the heritability. Here we report a user-friendly software tool called genome-wide complex trait analysis (GCTA), which was developed based on a method we recently developed to address the ?missing heritability? problem. GCTA estimates the variance explained by all the SNPs on a chromosome or on the whole genome for a complex trait rather than testing the association of any particular SNP to the trait. We introduce GCTA's five main functions: data management, estimation of the genetic relationships from SNPs, mixed linear model analysis of variance explained by the SNPs, estimation of the linkage disequilibrium structure, and GWAS simulation. We focus on the function of estimating the variance explained by all the SNPs on the X chromosome and testing the hypotheses of dosage compensation. The GCTA software is a versatile tool to estimate and partition complex trait variation with large GWAS data sets.
FaST linear mixed models for genome-wide association studies. Lippert, Christoph; Listgarten, Jennifer; Liu, Ying; Kadie, Carl M; Davidson, Robert I; Heckerman, David (2011). 8(10) 833–835.
An algorithm for linear mixed models substantially reduces memory usage and run time for genome-wide association studies. The improved algorithm scales linearly in cohort size, allowing the application of these models to much larger samples.
Variance component model to account for sample structure in genome-wide association studies. Kang, Hyun Min; Sul, Jae Hoon; Service, Susan K; Zaitlen, Noah A; Kong, Sit-yee; Freimer, Nelson B; Sabatti, Chiara; Eskin, Eleazar (2010). 42(4) 348–354.
Eleazar Eskin and colleagues report a variance component model for correcting for sample structure in association studies. The EMMAX program is publicly available and may be used for analysis of genome-wide association study datasets.
Mixed linear model approach adapted for genome-wide association studies. Zhang, Zhiwu; Ersoz, Elhan; Lai, Chao-Qiang; Todhunter, Rory J; Tiwari, Hemant K; Gore, Michael A; Bradbury, Peter J; Yu, Jianming; Arnett, Donna K; Ordovas, Jose M; Buckler, Edward S (2010). 42(4) 355–360.
Zhiwu Zhang and colleagues report a mixed linear model approach for correcting for population structure and family relatedness in genome-wide association studies.
Efficient Control of Population Structure in Model Organism Association Mapping. Kang, Hyun Min; Zaitlen, Noah A; Wade, Claire M; Kirby, Andrew; Heckerman, David; Daly, Mark J; Eskin, Eleazar (2008). 178(3) 1709–1723.
Genomewide association mapping in model organisms such as inbred mouse strains is a promising approach for the identification of risk factors related to human diseases. However, genetic association studies in inbred model organisms are confronted by the problem of complex population structure among strains. This induces inflated false positive rates, which cannot be corrected using standard approaches applied in human association studies such as genomic control or structured association. Recent studies demonstrated that mixed models successfully correct for the genetic relatedness in association mapping in maize and Arabidopsis panel data sets. However, the currently available mixed-model methods suffer from computational inefficiency. In this article, we propose a new method, efficient mixed-model association (EMMA), which corrects for population structure and genetic relatedness in model organism association mapping. Our method takes advantage of the specific nature of the optimization problem in applying mixed models for association mapping, which allows us to substantially increase the computational speed and reliability of the results. We applied EMMA to in silico whole-genome association mapping of inbred mouse strains involving hundreds of thousands of SNPs, in addition to Arabidopsis and maize data sets. We also performed extensive simulation studies to estimate the statistical power of EMMA under various SNP effects, varying degrees of population structure, and differing numbers of multiple measurements per strain. Despite the limited power of inbred mouse association mapping due to the limited number of available inbred strains, we are able to identify significantly associated SNPs, which fall into known QTL or genes identified through previous studies while avoiding an inflation of false positives. An R package implementation and webserver of our EMMA method are publicly available.
Probe-It! Visualization Support for Provenance. Del Rio, Nicholas; da Silva, Paulo Pinheiro G. Bebis, R. Boyle, B. Parvin, D. Koracin, N. Paragios, S.-M. Tanveer, T. Ju, Z. Liu, S. Coquillart, C. Cruz-Neira, T. Müller, T. Malzbender (eds.) (2007). 732–741.
Visualization is a technique used to facilitate the understanding of scientific results such as large data sets and maps. Provenance techniques can also aid in increasing the understanding and acceptance of scientific results by providing access to information about the sources and methods which were used to derive them. Visualization and provenance techniques, although rarely used in combination, may further increase scientists' understanding of results since the scientists may be able to use a single tool to see and evaluate result derivation processes including any final or partial result. In this paper we introduce Probe-It!: a visualization tool for scientific provenance information that enables scientists to move the visualization focus from intermediate and final results to provenance back and forth. To evaluate the benefits of Probe-It!, in the context of maps, this paper presents a quantitative user study on how the tool was used by scientists to discriminate between quality results and results with known imperfections. The study demonstrates that only a very small percentage of the scientists tested can identify imperfections using maps without the help of knowledge provenance and that most scientists, whether GIS experts, subject matter experts (i.e., experts on gravity data maps) or not, can identify and explain several kinds of map imperfections when using maps together with knowledge provenance visualization.
Philosophy, the ’unknown knowns’, and the public use of reason. Žižek, Slavoj (2006). 25(1) 137–142.
There are not only true or false solutions, there are also false questions. The task of philosophy is not to provide answers or solutions, but to submit to critical analysis the questions themselves, to make us see how the very way we perceive a problem is an obstacle to its solution. This holds especially for today’s public debates on ecological threats, on lack of faith, on democracy and the “war on terrorâ€, in which the “unknown knownsâ€, the silent presuppositions we are not aware of, determine our acts.
A unified mixed-model method for association mapping that accounts for multiple levels of relatedness. Yu, Jianming; Pressoir, Gael; Briggs, William H; Vroh Bi, Irie; Yamasaki, Masanori; Doebley, John F; McMullen, Michael D; Gaut, Brandon S; Nielsen, Dahlia M; Holland, James B; Kresovich, Stephen; Buckler, Edward S (2006). 38(2) 203–208.
As population structure can result in spurious associations, it has constrained the use of association studies in human and plant genetics. Association mapping, however, holds great promise if true signals of functional association can be separated from the vast number of false signals generated by population structure1,2. We have developed a unified mixed-model approach to account for multiple levels of relatedness simultaneously as detected by random genetic markers. We applied this new approach to two samples: a family-based sample of 14 human families, for quantitative gene expression dissection, and a sample of 277 diverse maize inbred lines with complex familial relationships and population structure, for quantitative trait dissection. Our method demonstrates improved control of both type I and type II error rates over other methods. As this new method crosses the boundary between family-based and structured association samples, it provides a powerful complement to currently available methods for association mapping.
Provenance and Annotation for Visual Exploration Systems. Groth, D.P.; Streefkerk, K. (2006). 12(6) 1500–1510.
Exploring data using visualization systems has been shown to be an extremely powerful technique. However, one of the challenges with such systems is an inability to completely support the knowledge discovery process. More than simply looking at data, users will make a semipermanent record of their visualizations by printing out a hard copy. Subsequently, users will mark and annotate these static representations, either for dissemination purposes or to augment their personal memory of what was witnessed. In this paper, we present a model for recording the history of user explorations in visualization environments, augmented with the capability for users to annotate their explorations. A prototype system is used to demonstrate how this provenance information can be recalled and shared. The prototype system generates interactive visualizations of the provenance data using a spatio-temporal technique. Beyond the technical details of our model and prototype, results from a controlled experiment that explores how different history mechanisms impact problem solving in visualization environments are presented.
QMPE: Estimating Lognormal, Wald, and Weibull RT distributions with a parameter-dependent lower bound. Heathcote, Andrew; Brown, Scott; Cousineau, Denis (2004). 36(2) 277–290.
We describe and test quantile maximum probability estimator (QMPE), an open-source ANSI Fortran 90 program for response time distribution estimation.1 QMPE enables users to estimate parameters for the ex-Gaussian and Gumbel (1958) distributions, along with three “shifted” distributions (i.e., distributions with a parameter-dependent lower bound): the Lognormal, Wald, and Weibull distributions. Estimation can be performed using either the standard continuous maximum likelihood (CML) method or quantile maximum probability (QMP; Heathcote & Brown, in press). We review the properties of each distribution and the theoretical evidence showing that CML estimates fail for some cases with shifted distributions, whereas QMP estimates do not. In cases in which CML does not fail, a Monte Carlo investigation showed that QMP estimates were usually as good, and in some cases better, than CML estimates. However, the Monte Carlo study also uncovered problems that can occur with both CML and QMP estimates, particularly when samples are small and skew is low, highlighting the difficulties of estimating distributions with parameter-dependent lower bounds.
Earth System Science Workbench: a data management infrastructure for earth science products. Frew, J.; Bose, R. (2001). 180–189.
The Earth System Science Workbench (ESSW) is a non-intrusive data management infrastructure for researchers who are also data publishers. An implementation of ESSW to track the processing of locally received satellite imagery is presented, demonstrating the Workbench's transparent and robust support for archiving and publishing data products. ESSW features a Lab Notebook metadata service, an ND-WORM (No Duplicate-Write Once Read Many) storage service, and Web user interface tools. The Lab Notebook logs processes (experiments) and their relationships via a custom API to XML documents stored in a relational database. The ND-WORM provides a managed storage archive for the Lab Notebook by keeping unique file digests and name-space meta-data, also in a relational database. ESSW Notebook tools allow project searching and ordering, and file and meta-data management.
Defacement : public secrecy and the labor of the negative Taussig, Michael T. (1999). Stanford University Press, Stanford, California.
A Simple Method for Computing the Inverse of a Numerator Relationship Matrix Used in Prediction of Breeding Values. Henderson, C. R. (1976). 32(1) 69–83.
The inverse of a numerator relationship matrix is needed for best linear unbiased prediction of breeding values. The purpose of this paper to is present a rapid and simple method for computation of the elements of this inverse without computing the relationship matrix itself. The method is particularly useful in non-inbred populations but is much faster than the conventional method in the presence of inbreeding.
Rapid Method for Computing the Inverse of a Relationship Matrix. Henderson, C.R. (1975). 58(11) 1727–1730.
The accuracy of prediction of breeding values can be improved by utilizing all relationships among animals to be evaluated. The inverse of the numerator relationship matrix is required for best prediction but is usually much too large to be computed by conventional inversion routines. A simple and rapid technique for finding this inverse directly from a list of sires and dams, bypassing computation of the matrix whose inverse is wanted, is presented.
Uloga džamije Mehmed-bega Stočanina u formiranju Gornjeg Vakufa: povodom nove izgradnje džamije Hadžijahić, Muhamed; Mujezinović, Mehmed; Hadžiabdić, Fahrija (1971). 48. Odbor islamske zajednice Gornji Vakuf, Gornji Vakuf.
Estimation of Variance and Covariance Components. Henderson, C. R. (1953). 9(2) 226–252.
The theory of variance component analysis has been discussed recently by Crump (1946, 1951) and by Eisenhart (1947). These papers and, indeed, most of the published works on estimating variance components deal with the one-way classification, with "nested" classi- fications, and with factorial classifications having equal subclass numbers. Also most papers on this subject are concerned with what Eisenhart (1947) has called Model II; that is, all elements of the linear model save gi are regarded as random variables. In the above cases, estimation of variance components is usually accomplished by com- puting the mean squares in the standard analysis of variance, equating these mean squares to their expectations, and solving for the unknown variances. These techniques are described in many statistical text- books. Unfortunately, research workers in some of those fields in which much use is made of variance component estimates are unable to obtain data which have the above described characteristics. This is par- ticularly true in those fields in which survey data must be used or where, even in a well-planned experiment, the subclasses are of quite unequal size due, for example, to differences in litter numbers. Also, *Presented at North Carolina Summer Statistics Conference June 24, 1952. 226 This content downloaded from 128.223.223.24 on Thu, 13 Feb 2025 16:56:05 UTC All use subject to https://about.jstor.org/terms VARIANCE AND COVARIANCE COMPONENTS 227 Model II is sometimes not appropriate. Instead the data more ap- propriately correspond to what Eisenhart called the Mixed Model. For example, the data may represent several different years, and the year effects should be regarded as fixed rather than as random variables. It is the purpose of this paper to describe some methods for esti- mating variance components in the non-orthogonal case and to illus- trate the methods with a small sample of butterfat records made by cows resulting from an artificial breeding program. The three methods described are: 1. Compute sums of squares as in the standard analysis of variance of corresponding orthogonal data. Equate these sums of squares to their expectations obtained under the assumption of Model II and solve for the unknown variances. 2. Obtain least squares estimates of fixed effects, "correct" the data according to these estimates of the fixed effects, and then using the corrected data in place of the original data, proceed as in Method 1. 3. Compute mean squares by a conventional least squares analysis of non-orthogonal data (method of fitting constants, weighted squares of means, e.g.). Equate these mean squares to their expectations and solve for the unknown variances. These three methods henceforth called Method 1, Method 2, and Method 3 vary greatly in computational labor. Method 1 is the simplest. Method 2 in many cases is only slightly more difficult. Method 3 is usually much the most laborious. Method 1, however, leads to biased estimates if certain elements of the model are fixed or if some of them are correlated. Estimates obtained by Method 2 are free of the first of these biases, but not of the second. Method 3 yields unbiased estimates, but the computations required may be prohibitive. The relative sizes of the sampling variances of estimates obtained by these three methods are not known
Glasnik Zemaljskog muzeja u Bosni i Hercegovini Vol.1, no.1, p. 1-96 Hörmann, Kosta (1889). Zemaljski muzej u Bosni i Hercegovini, Sarajevo.